Submit an Article
Navigate
Home
Editorial Board
Editorial Policies
Current Volume
Archive
Scientific Integrity
Publication Ethics Statements
Interviews with Outstanding Authors
Newsroom
Sponsored Conferences
Podcast
Contact
Special Collections
Submit an Article
Online ISSN: 1945-4589
Research Paper
|
Volume 15, Issue 18
|
pp. 9426–9437
The mechanism of simultaneous intake of Jujuboside A and B in the regulation of sleep at the hypothalamic level
Back to article
Figure 6
(6 of 6)
−
100%
+
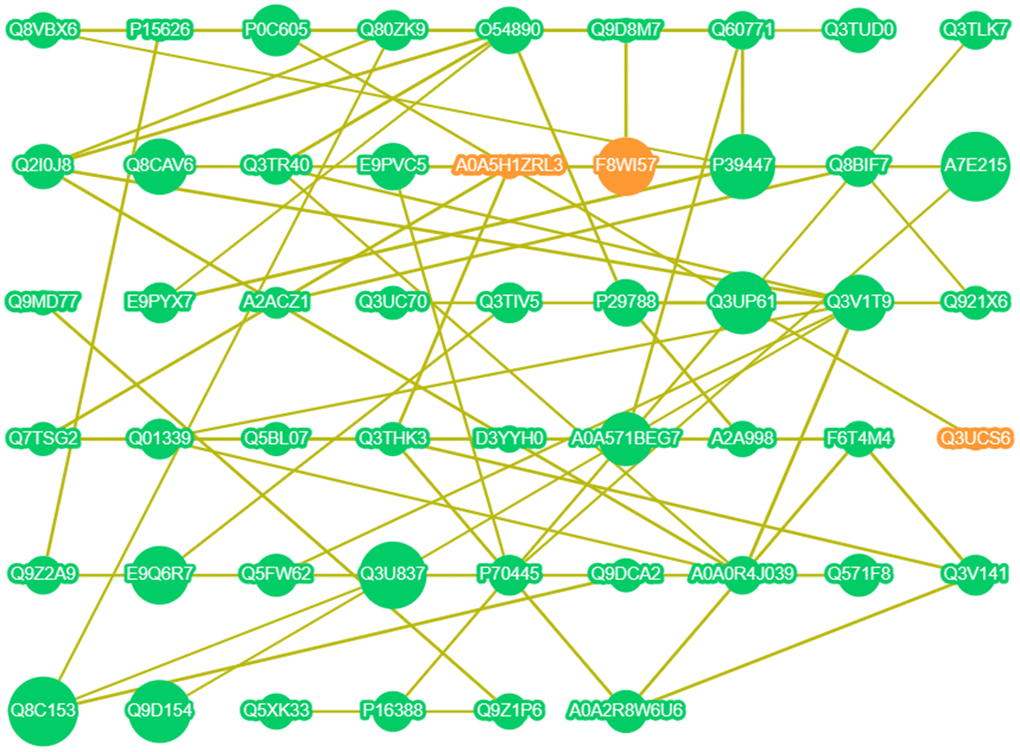
Figure 6.
Interaction network of DE proteins.
Orange point: up-regulated expression; Green point: down-regulated expression; The larger the point, the higher the correlation; The line indicates that there is a correlation.