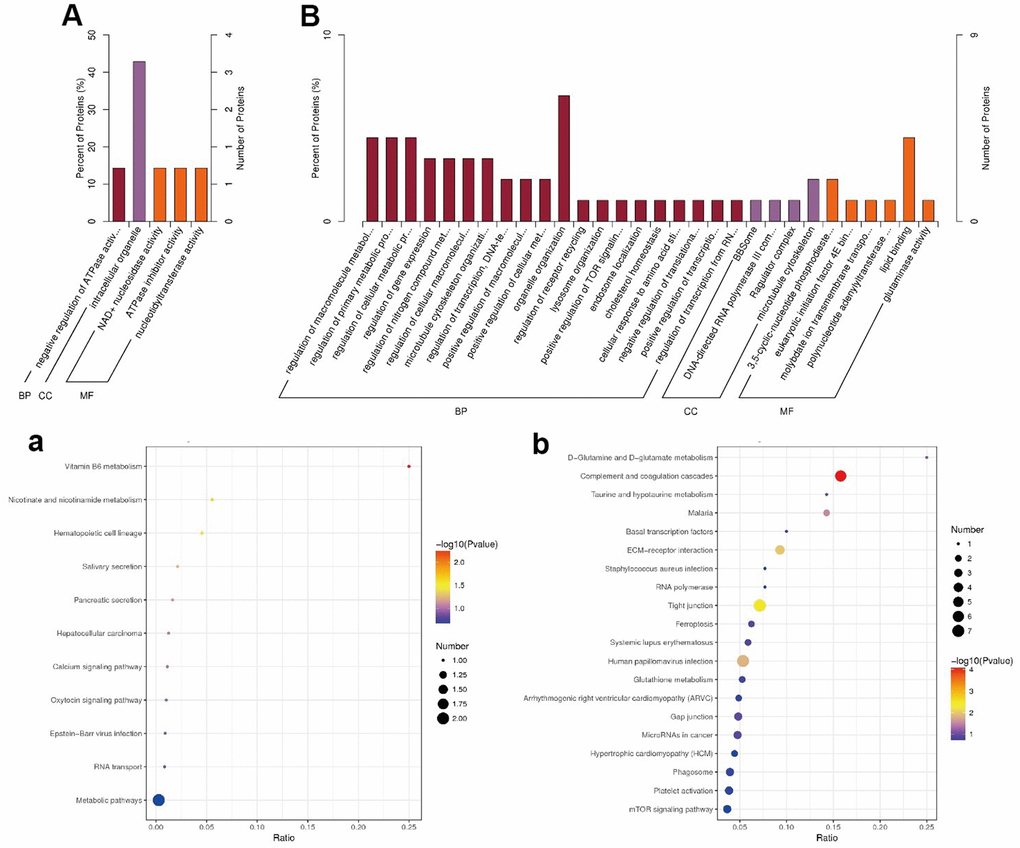
Figure 4.Go (A, B) and KEGG (a, b) enrichment results (A, a) Up-regulated; (B, b) Down-regulated. In (A, B), Value of x-axis: ; The color of the point: the p-value of the hypergeometric test; The size of the point: the number of DE proteins in the corresponding pathway.