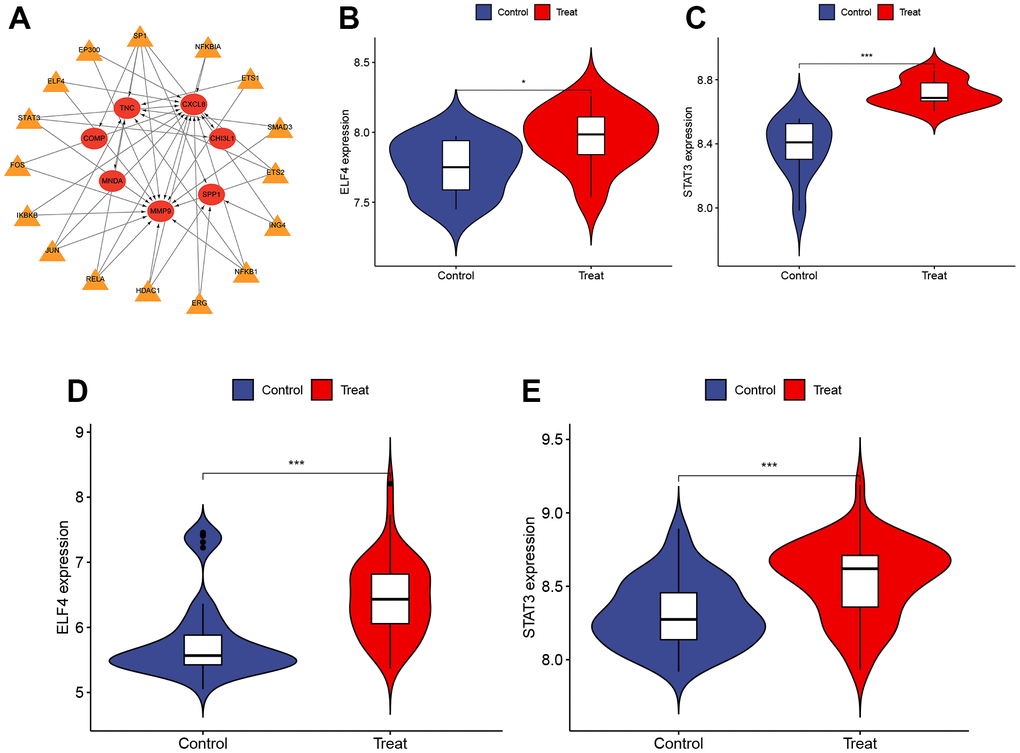
Figure 5.Identification and validation of TFs. (A) The TFs regulatory network. Red represents the hub genes and yellow represents the TFs. (B, C) The expression of ELF4 and STAT3 in GSE151839 dataset ((B) P < 0.05, (C) P < 0.001). (D, E) The expression of ELF4 and STAT3 in GSE33630 dataset ((D) P < 0.001, (E) P < 0.001). P < 0.001 was denoted as “***”, P < 0.01 as “**”, P < 0.05 as “*”, and P > 0.05 as “ns”.