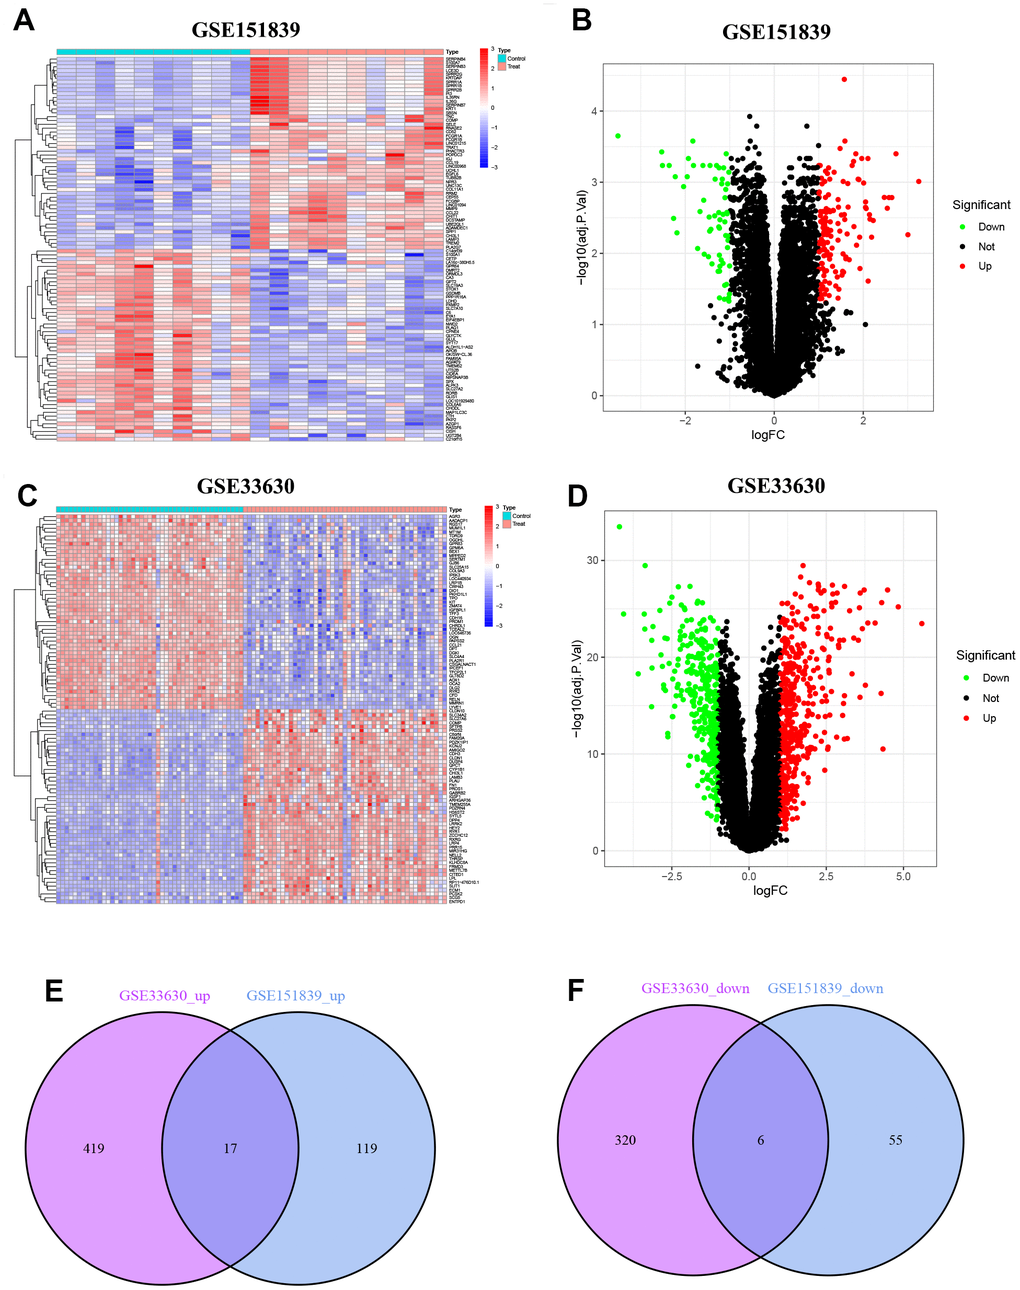
Figure 1.Identification of DEGs. (A) Heatmap of DEGs in GSE151839. (B) Volcano plot of DEGs in GSE151839. (C) Heatmap of DEGs in GSE33630. (D) Volcano plot of DEGs in GSE33630. (E) Venn diagram shown the 17 up-regulated DEGs between GSE151839 and GSE33630 datasets. (F) Venn diagram shown the 6 down-regulated DEGs between GSE151839 and GSE33630 datasets.