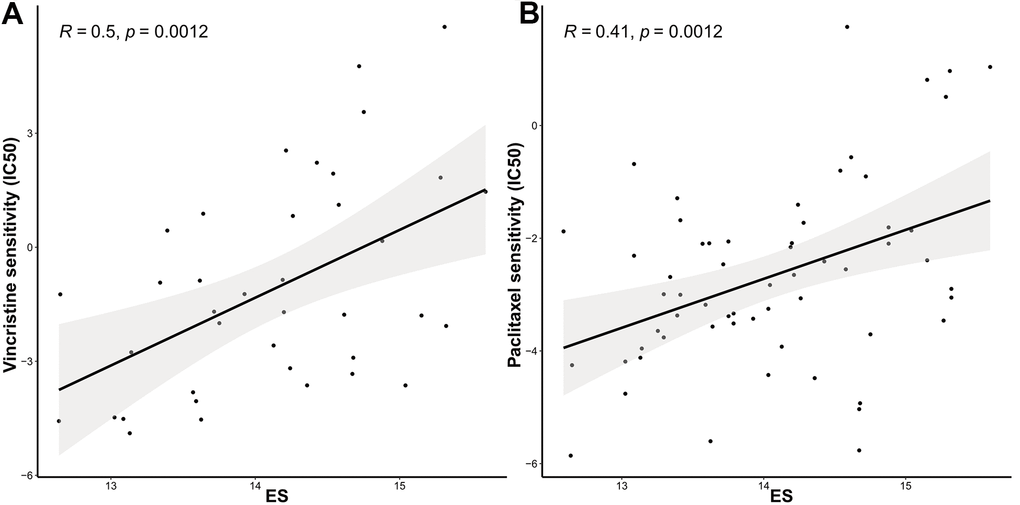
Figure 5.The ES predicting the sensitivity to chemosensitivity and endocrine therapy. Scatter plots for associations between drug sensitivity values (IC50) and (A) vincristine, (B) paclitaxel.
(C) docetaxel, (D) doxorubicin, (E) cisplatin, (F) tamoxifen, and (G) fulvestrant; (H) Raincloud Plot showing the comparison of ES between endocrine therapy non-responder and responder groups. ES, exosome score; IC50, half maximal inhibitory concentration.