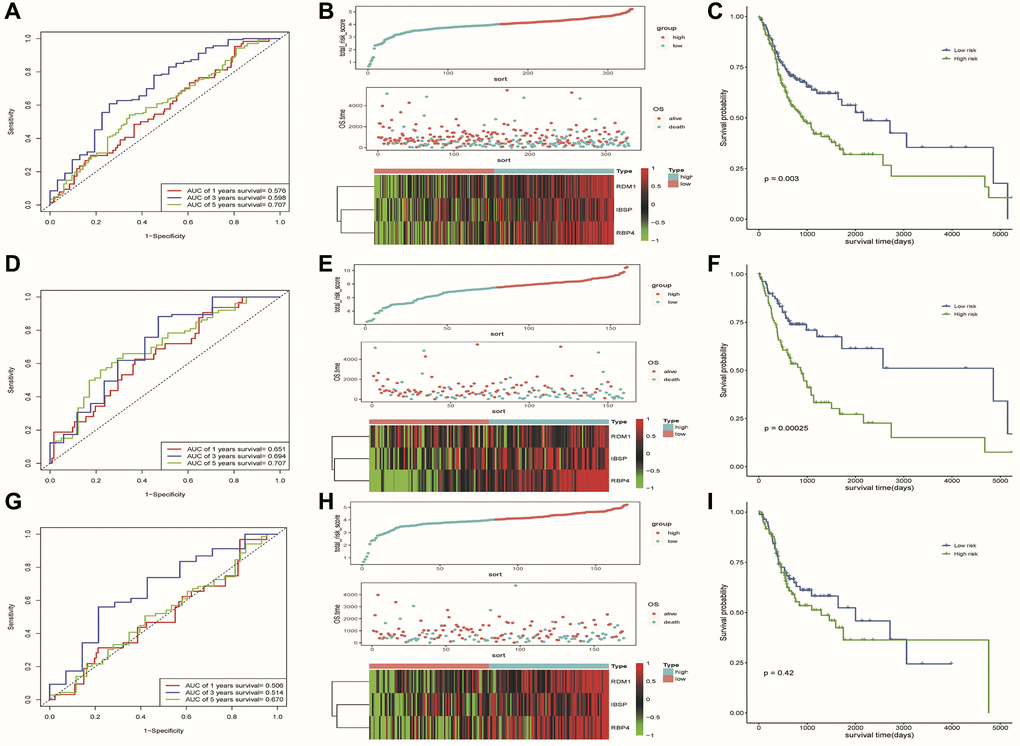
Figure 6.Results of assessment of the risk model's ability to predict prognosis. (A–C) ROC curve, riskplot and Kaplan-Meier curve of 3 DE-ERSs based on the all dataset. (D–F) ROC curve, riskplot and Kaplan-Meier curve of 3 DE-ERSs based on the training set; (G–I) ROC curve, riskplot and Kaplan-Meier curve of 3 DE-ERSs based on the testing set.