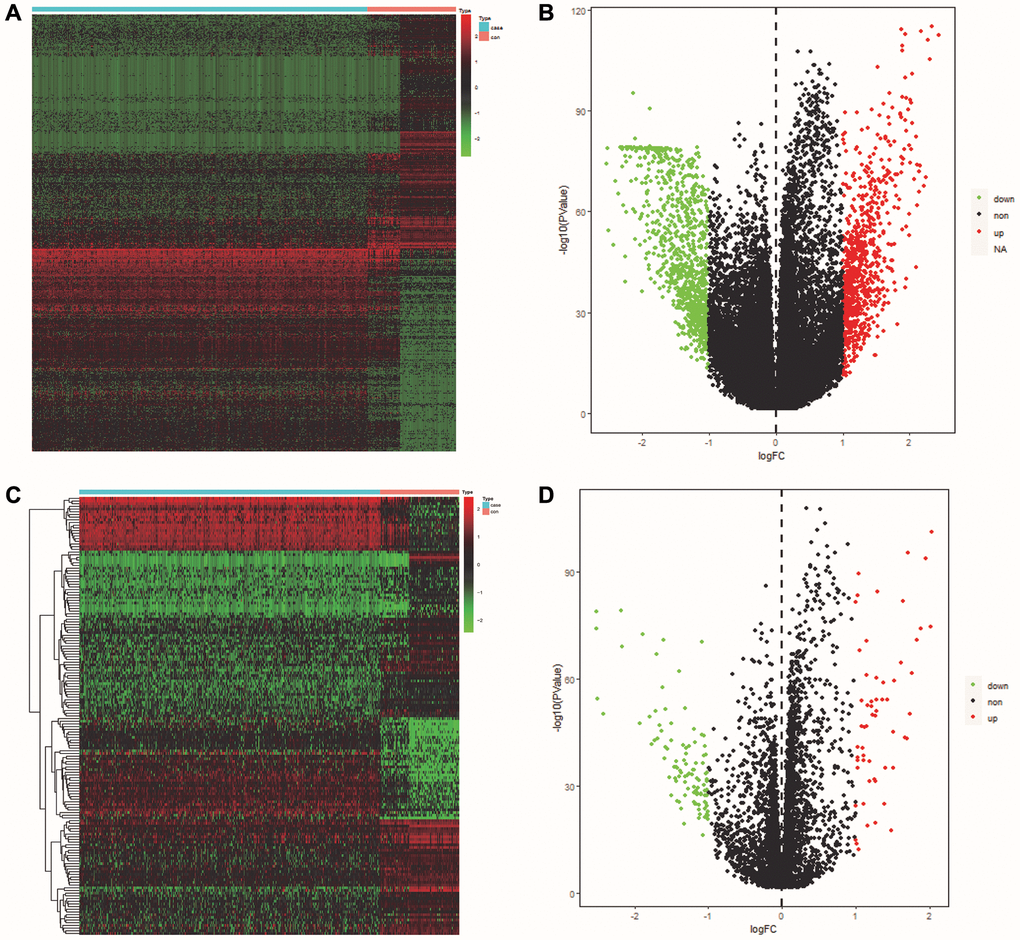
Figure 1.Identification of DEGs and DE-ERSs. (A) Heat map of DEGs based on TCGA OSCC data. (B) Volcano map of DEGs based on TCGA OSCC data. (C) Heat map of DE-ERSs based on TCGA and GeneCards OSCC data. (D) Volcano map of DE-ERSs based on TCGA and GeneCards OSCC data.