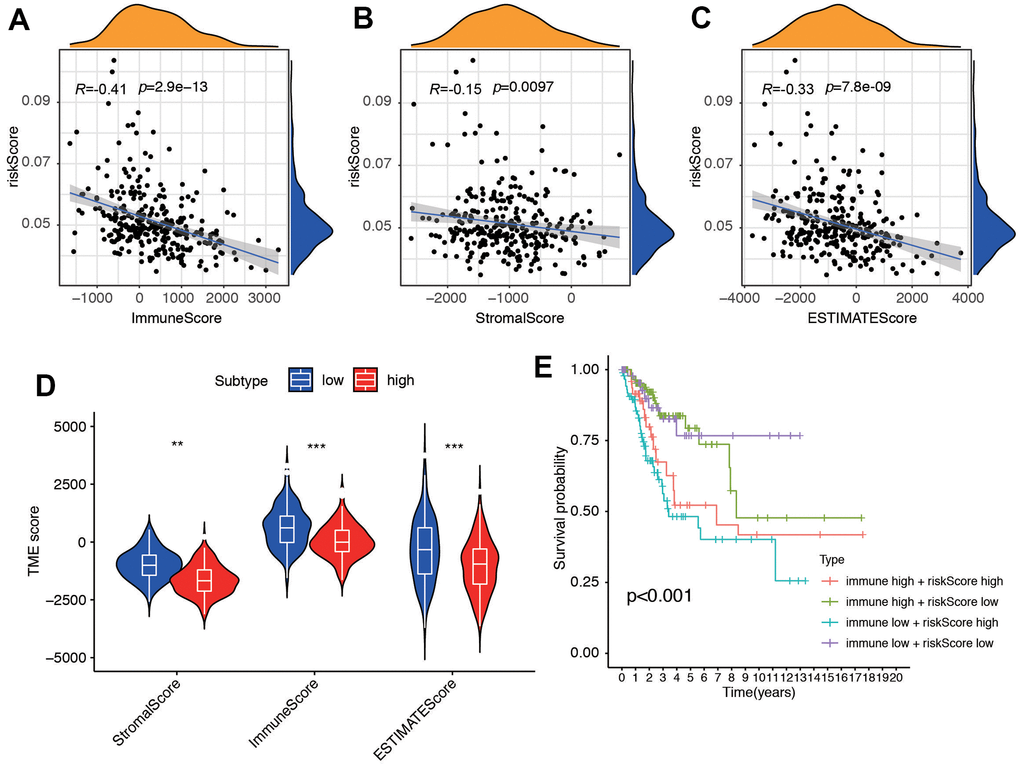
Figure 6.The association between tumor microenvironment and risk score. Correlation between (A) Immune Score, (B) Stromal Score and (C) ESTIMATE and risk score. (D) Different score between low- and high-risk groups. (E) Survival analysis for four groups stratified by combining the immune signature and the risk score characteristic in the TCGA-CC cohort.