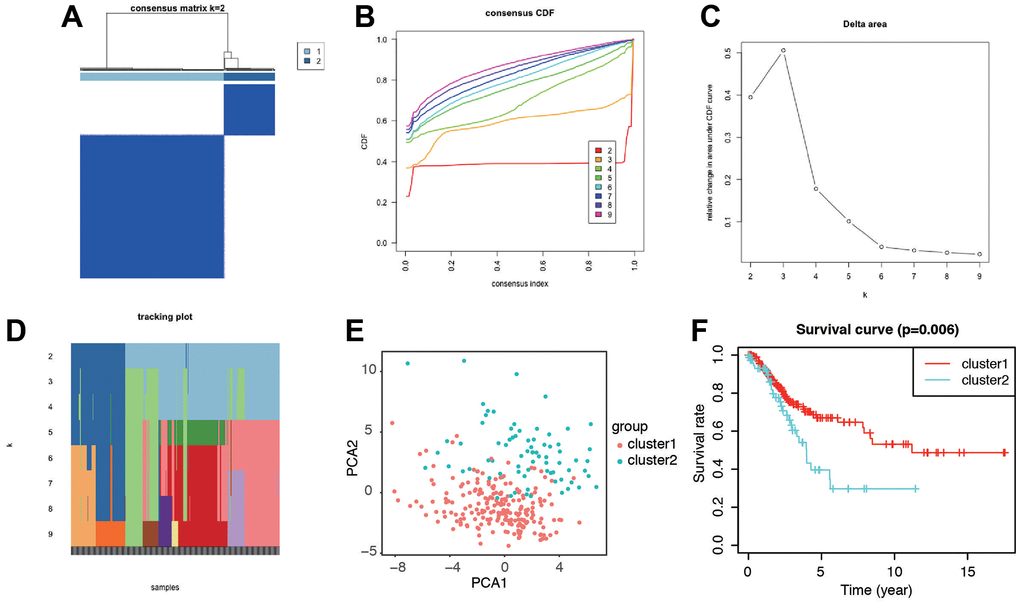
Figure 3.Identification of the molecular subtypes of the CC patients using the DEGs associated with senescence. (A) The CC patients were stratified into 2 clusters based on the consensus clustering matrix (k=2). (B–D) Consensus clustering model with cumulative distribution function (CDF) by k from 2 to 9. (E) The results of PCA analysis among the two subtypes. (F) Survival curves of patients in the two clusters.