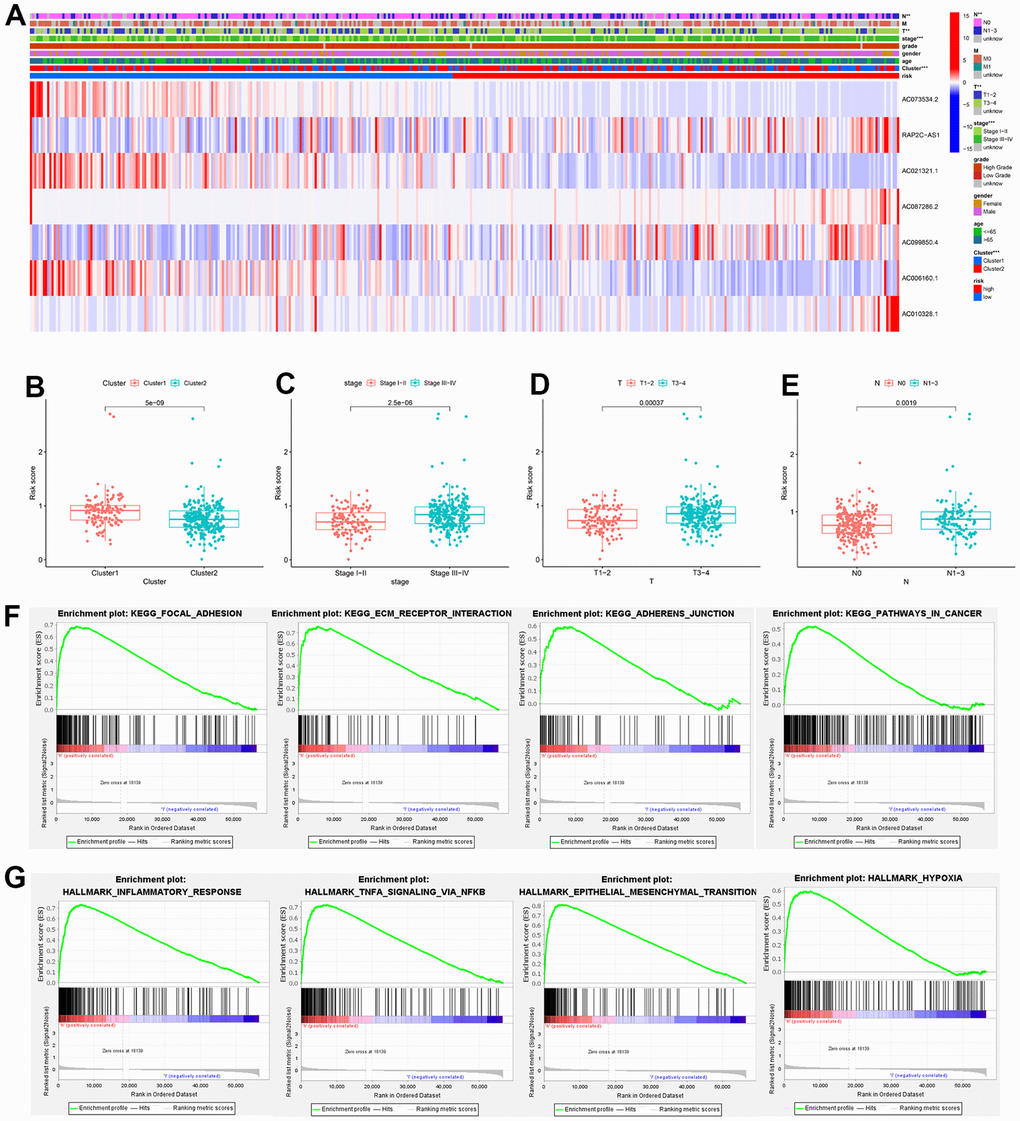
Figure 8.Heatmap of the clinical relevance and GSEA. (A) Heatmap of the distribution of clinical features and expression of 7 CRLs between two groups. (B–E) Differential expression analysis of risk score in patients with different clusters, AJCC stage, T stage, and N stage. (F) GSEA showed the significantly enriched KEGG gene sets in the high-risk group. (G) GSEA showed the significantly enriched Hallmark gene sets in the high-risk score. ** P<0.01,*** P<0.001.