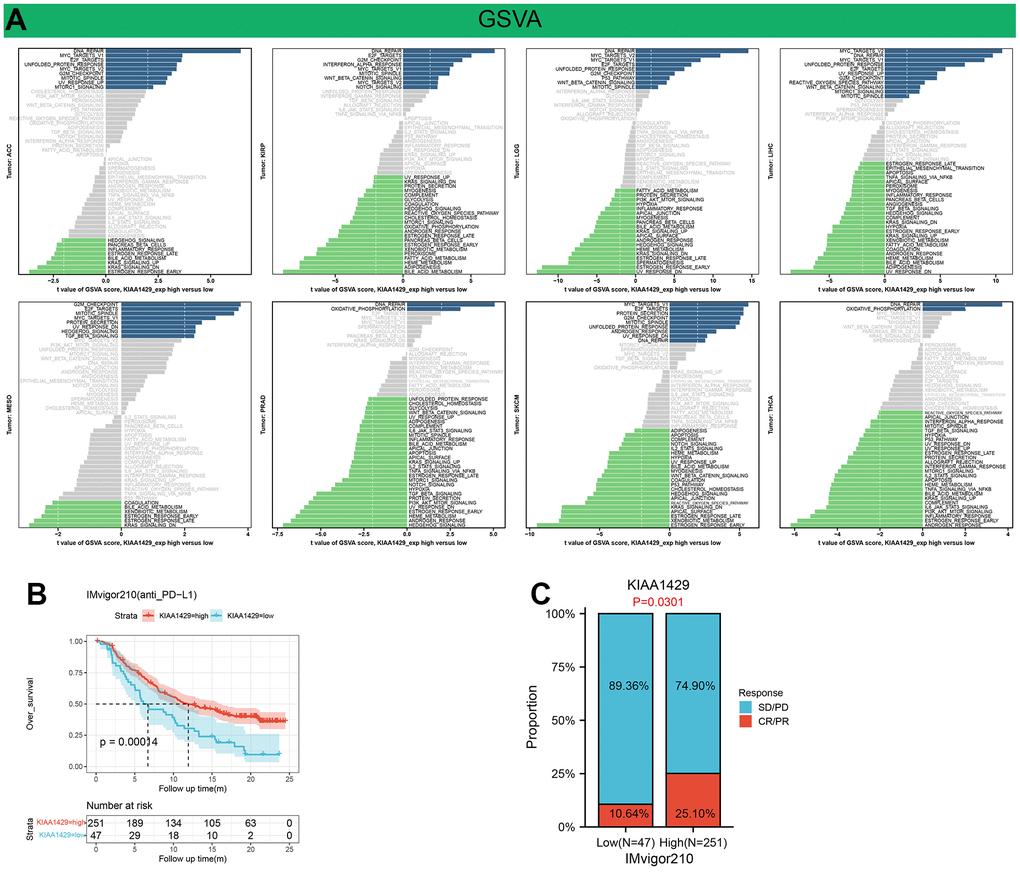
Figure 6.Results of GSVA and immunotherapy prediction analysis. (A) Differences in the scores for pathway activity between groups with high and low KIAA1429 expression. dn, down; UV, ultraviolet; v1, version 1; v2, version 2. (B) Kaplan-Meier analysis of the association between KIAA1429 expression and OS in the IMvigor210 cohort. (C) The proportion of BLCA patients who responded to anti-PD-L1 therapy in the low- and high-KIAA1429 subgroups.