Submit an Article
Navigate
Home
Editorial Board
Editorial Policies
Current Volume
Archive
Scientific Integrity
Publication Ethics Statements
Interviews with Outstanding Authors
Newsroom
Sponsored Conferences
Podcast
Contact
Special Collections
Submit an Article
Online ISSN: 1945-4589
Research Paper
|
Volume 15, Issue 17
|
pp. 8664–8691
Pan-cancer analysis and experimental validation revealed the m6A methyltransferase KIAA1429 as a potential biomarker for diagnosis, prognosis, and immunotherapy
Back to article
Figure 5
(5 of 8)
−
100%
+
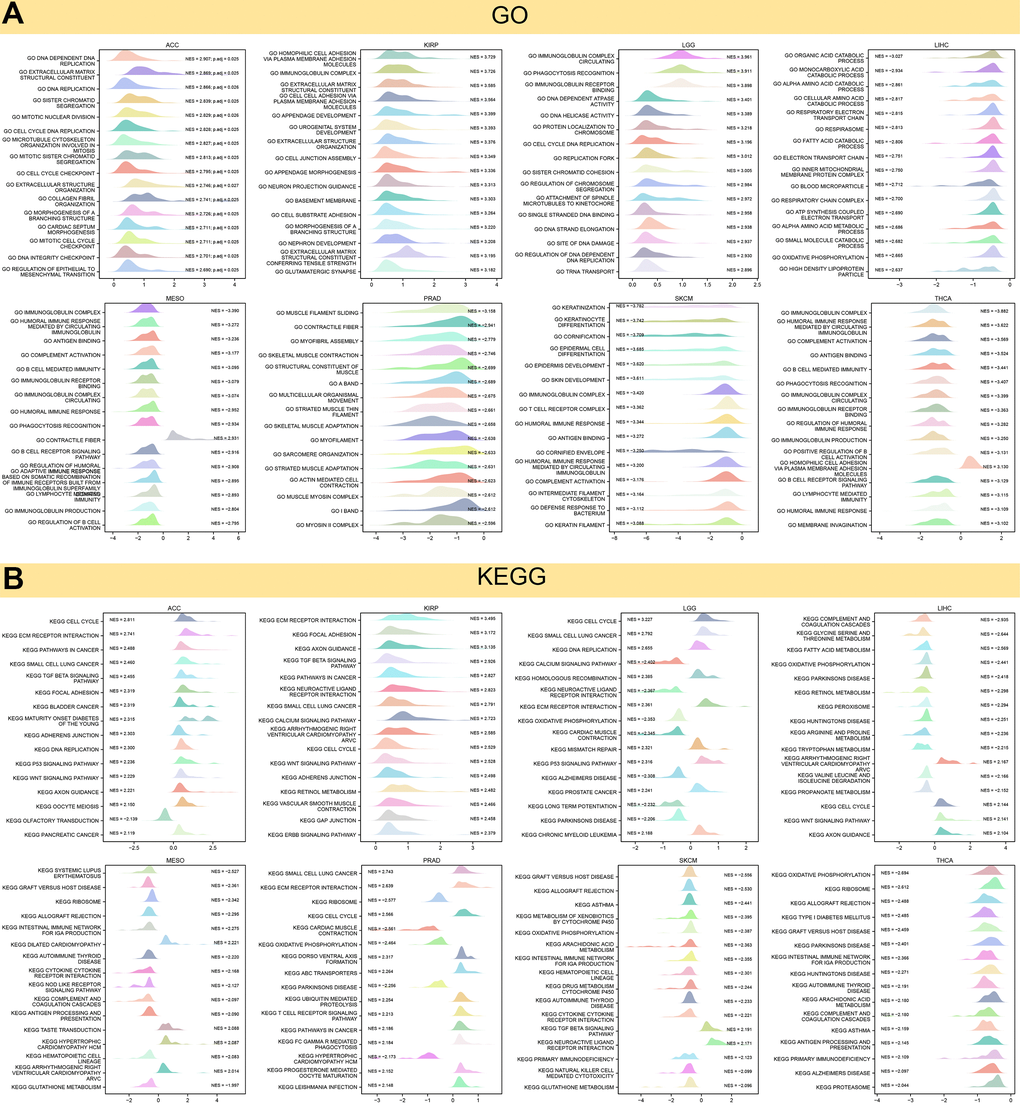
Figure 5.
Results of GSEA.
(
A
) GO functional annotation of KIAA1429 in pan-cancer. (
B
) KEGG pathway analysis of KIAA1429 in pan-cancer. Curves of different colors show different functions or pathways regulated in different cancers.