Submit an Article
Navigate
Home
Editorial Board
Editorial Policies
Current Volume
Archive
Scientific Integrity
Publication Ethics Statements
Interviews with Outstanding Authors
Newsroom
Sponsored Conferences
Podcast
Contact
Special Collections
Submit an Article
Online ISSN: 1945-4589
Research Paper
|
Volume 15, Issue 16
|
pp. 8185–8203
Construction of stemness gene score by bulk and single-cell transcriptome to characterize the prognosis of breast cancer
Back to article
Figure 4
(4 of 6)
−
100%
+
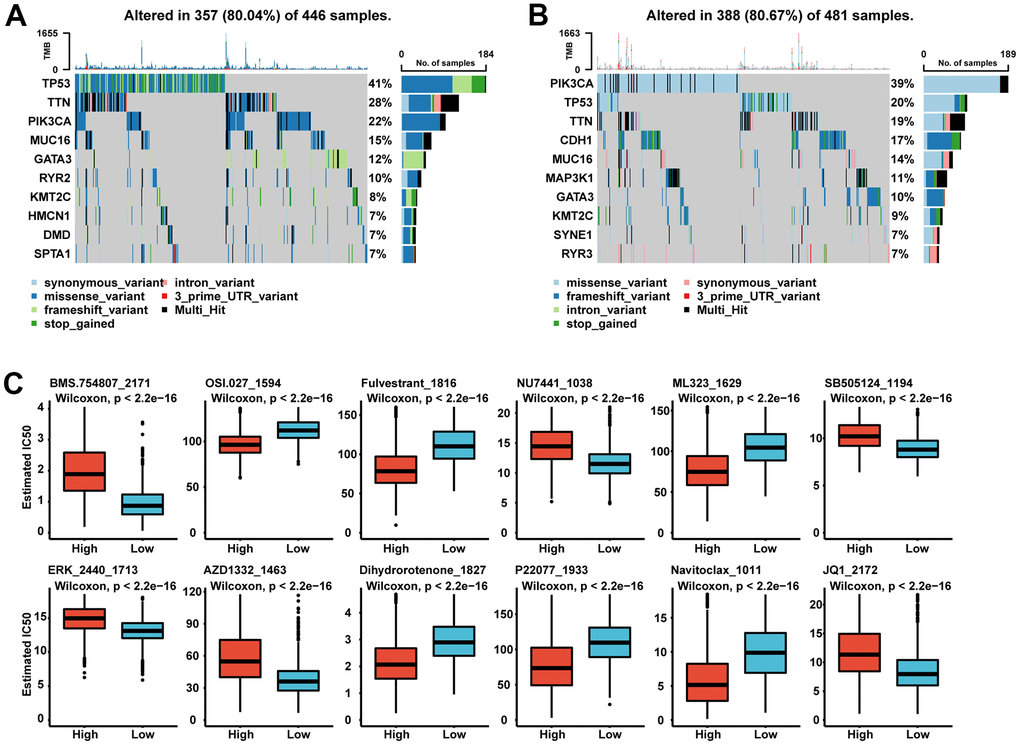
Figure 4.
(
A
,
B
) Oncoplot of landscape of mutation signatures between high SGS group (
A
) and low SGS group (
B
) in TCGA. (
C
) Boxplot of some representative of predicted IC50.