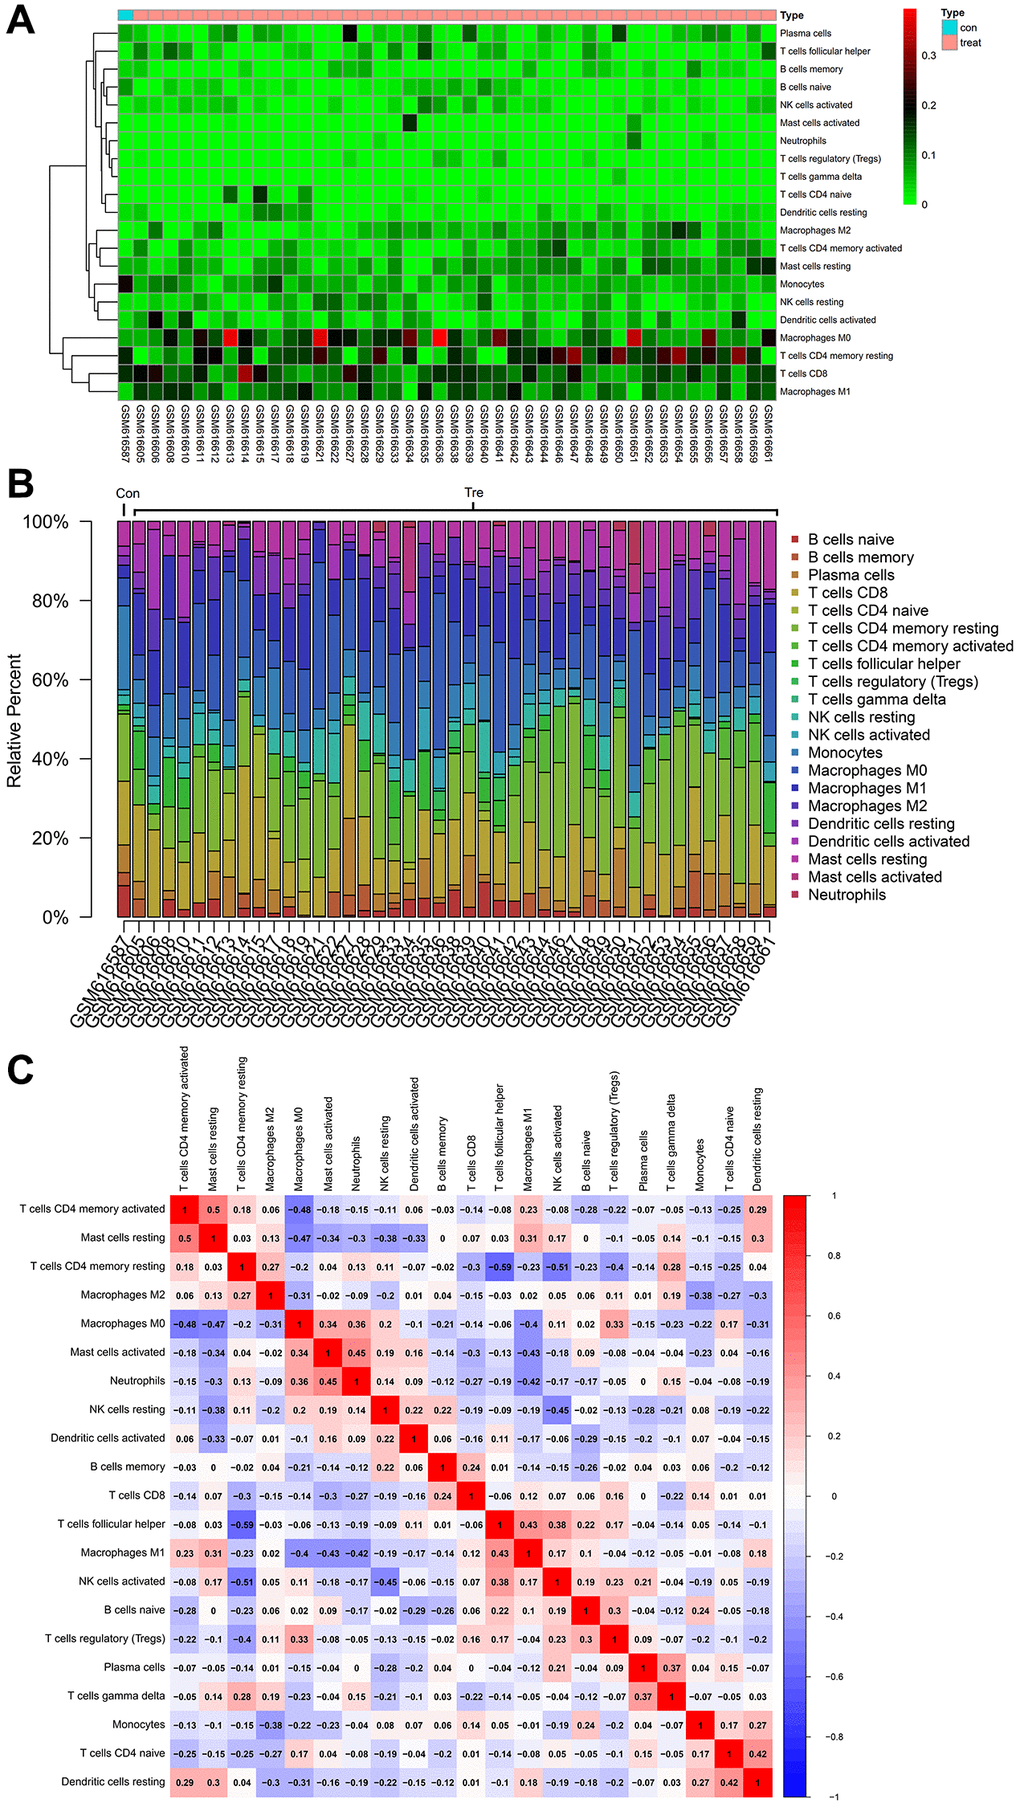
Figure 10.Immune infiltration analysis. (A) The proportion results of immune cells from the full gene expression matrix (B) The immune cell expression heatmap in the dataset (C) Diagram of coexpression patterns among immune cell components.
Figure 10 — CEACAM1 as a molecular target in oral cancer | Aging