Submit an Article
Navigate
Home
Editorial Board
Editorial Policies
Current Volume
Archive
Scientific Integrity
Publication Ethics Statements
Interviews with Outstanding Authors
Newsroom
Sponsored Conferences
Podcast
Contact
Special Collections
Submit an Article
Online ISSN: 1945-4589
Research Paper
|
Volume 15, Issue 16
|
pp. 8044–8060
The alleviating effect and mechanism of GLP-1 on ulcerative colitis
Back to article
Figure 7
(7 of 10)
−
100%
+
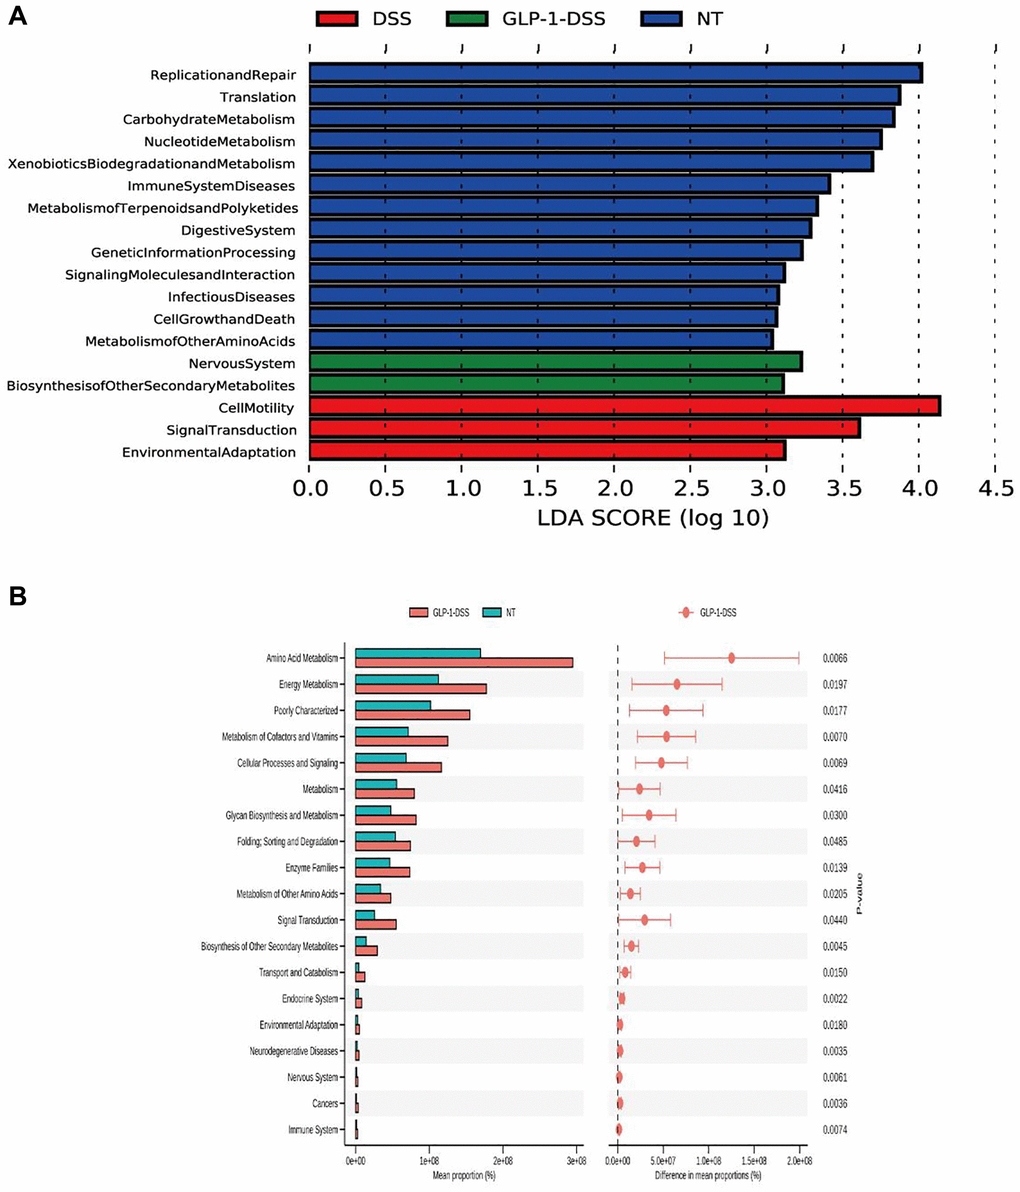
Figure 7.
(
A
) Gene function prediction. (
B
) Differential KEGG pathways between DSS-GLP-1 and NT groups.
Figure 7 — The alleviating effect and mechanism of GLP-1 on ulcerative colitis | Aging