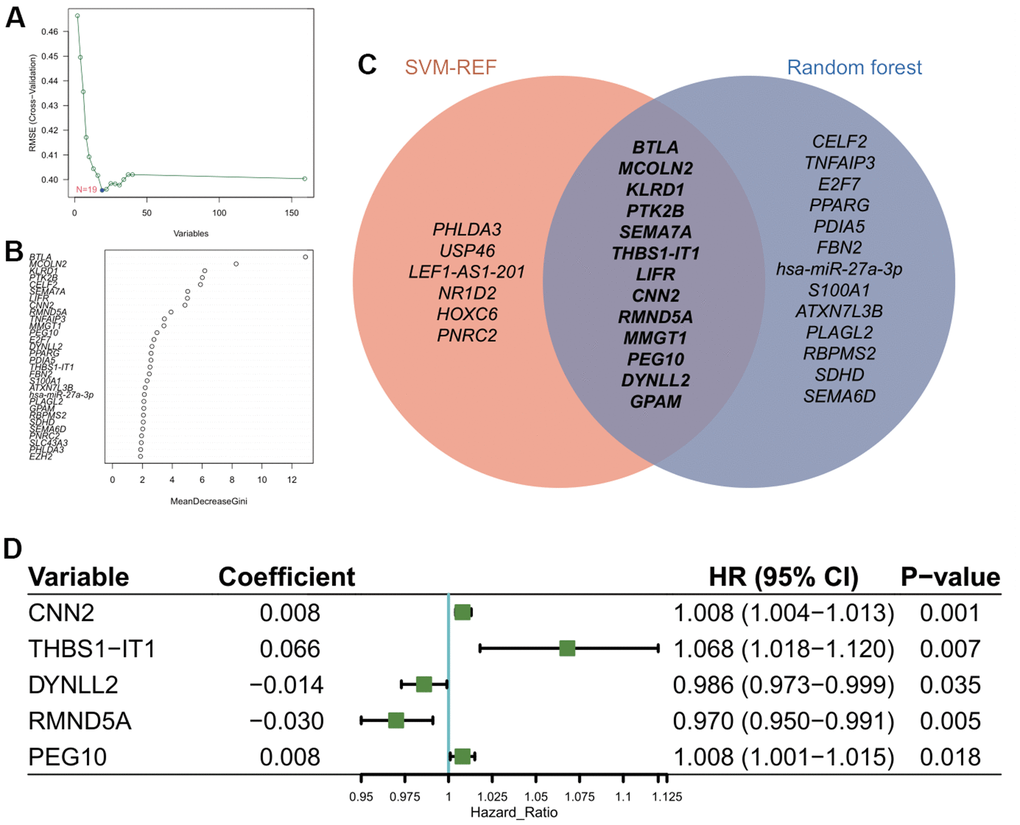
Figure 3.Construction of prognostic model using feature genes. (A) Identification of optimal gene set for the signature of CarLncs subgroups based on the SVM-RFE algorithm. (B) Top thirty genes with the highest “MeanDecreaseGini” for the optimal RF model. (C) Venn diagram of the overlapped genes of the two algorithms; (D) Independent prognostic factors for developing the aging related prognostic model were identified by Cox HR model.