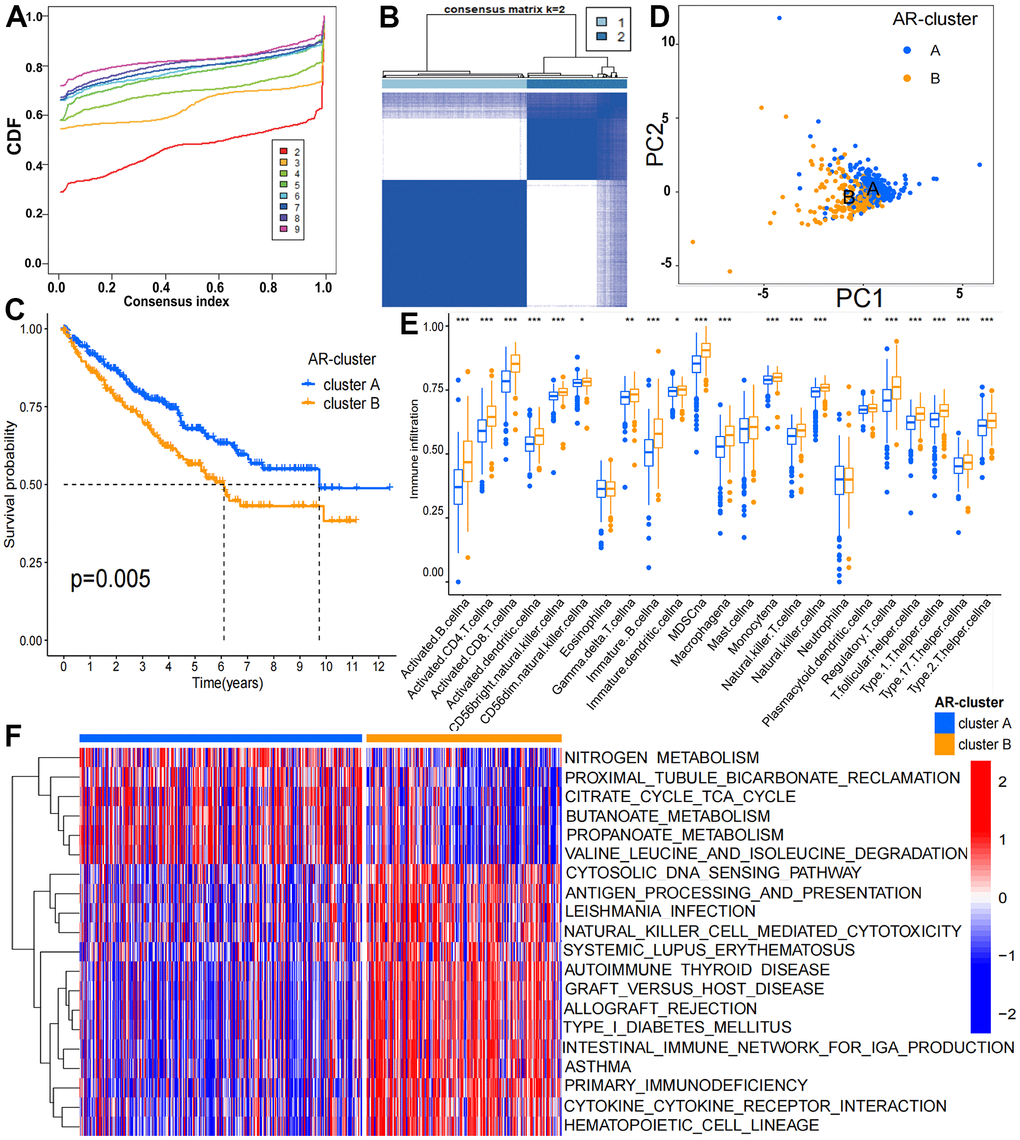
Figure 1.Clinicopathological and biological features of the two ARL subgroups divided by consistent clustering. (A) Consensus matrix CDFs from 2 to 9; (B) Two distinct clusters (k = 2) and their correlation area were identified by consensus matrix heatmap; (C) OS between cluster A and B is significantly different by KM analysis; (D) PCA analysis showed the transcriptome of the two subgroups is apparently different; (E) The abundance of 19 infiltrating immune cells is significantly different in two KIRC subgroups; (F) Biological pathways of the two distinct subgroups by GSVA analysis (p < 0.05 *; p < 0.01 **; p < 0.001 ***).