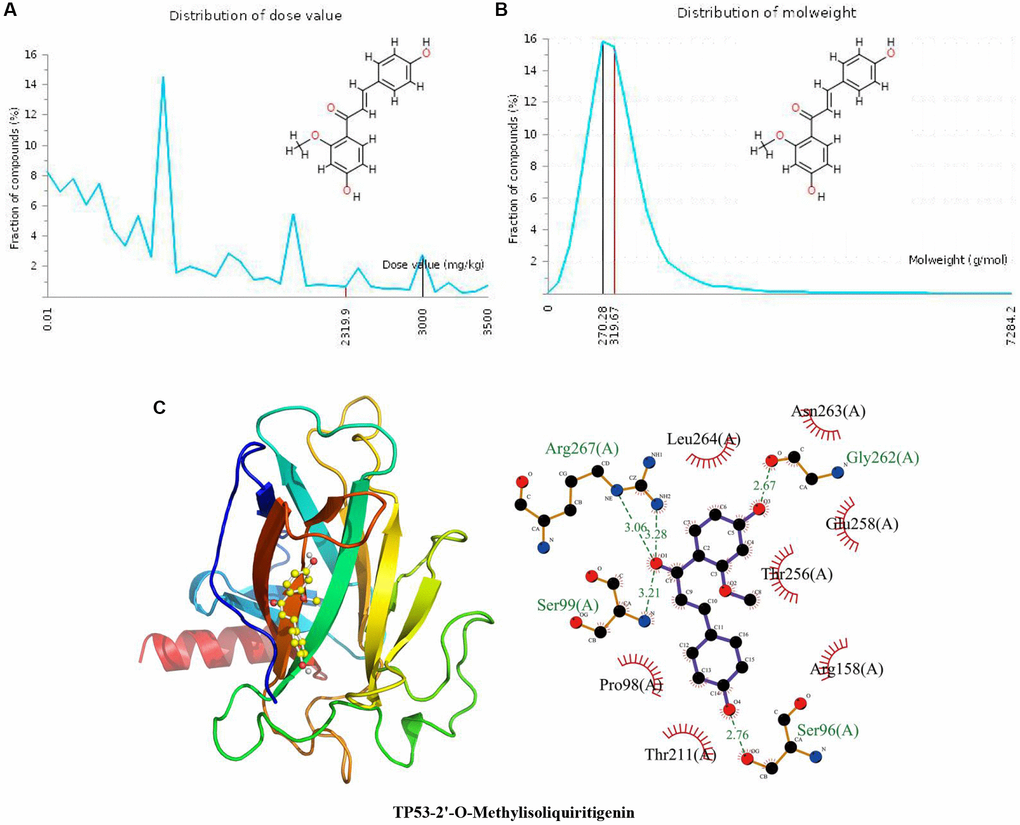
Figure 3.Distribution of the 2’-O-methylisoliquiritigenin dose value and molecular weight and docking with TP53. (A) Distribution of the dose value of 2’-O-methylisoliquiritigenin. (B) Distribution of the molecular weight of 2’-O-methylisoliquiritigenin. (C) Molecular docking of 2’-O-methylisoliquiritigenin with the TP53 protein.