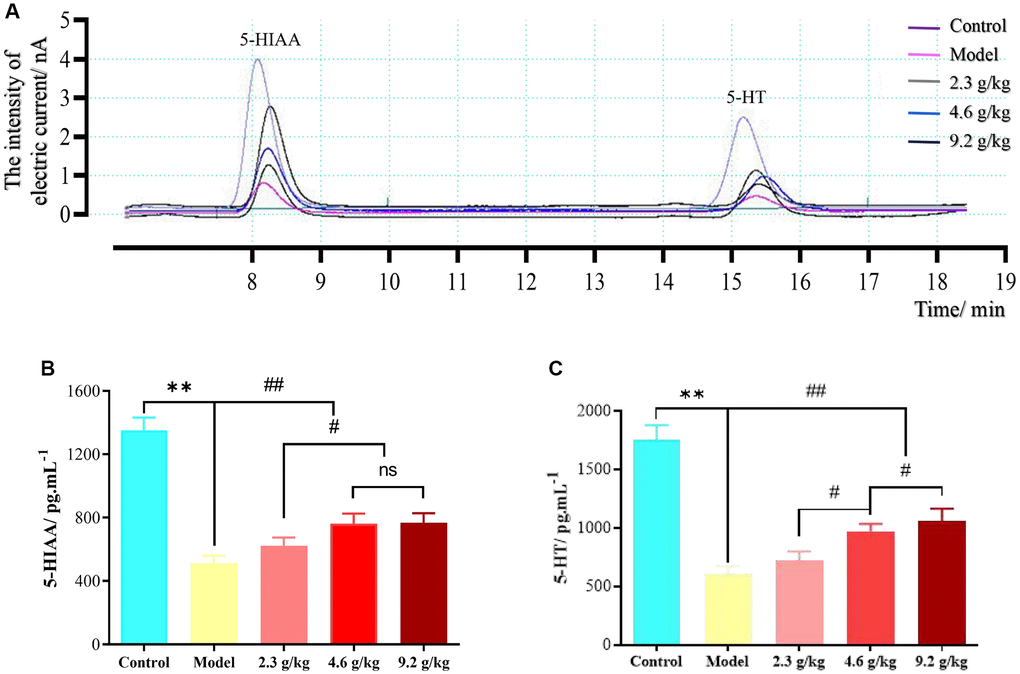
Figure 11.Cerebrospinal fluid microdialysis results for the hippocampal CA1 region in each group. (A) Chromatogram of neurotransmitters. (B) 5-HIAA levels in each group. (C) 5-HT levels in each group. The data are presented as means ± SD (n = 3). **P < 0.01 and ##P < 0.01 compared with the model group; #P < 0.05 compared with the 2.3 g/kg or 4.6 g/kg group. Abbreviation: ns: not significant.