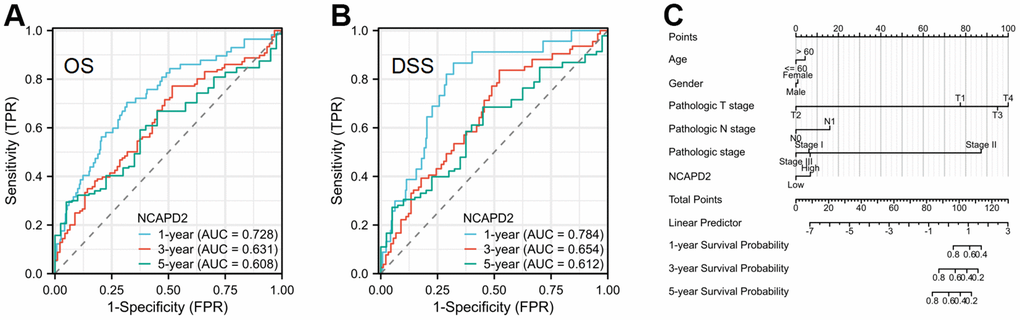
Figure 12.The time ROC curve of 1-, 3-, and 5-year OS and DSS in LIHC patients, and prognostic nomogram. (A) The time ROC curve of 1-, 3-, and 5-year OS in LIHC. (B) The time ROC curve of 1-, 3-, and 5-year DSS in LIHC. (C) The prognostic nomogram of NCAPD2 in LIHC.