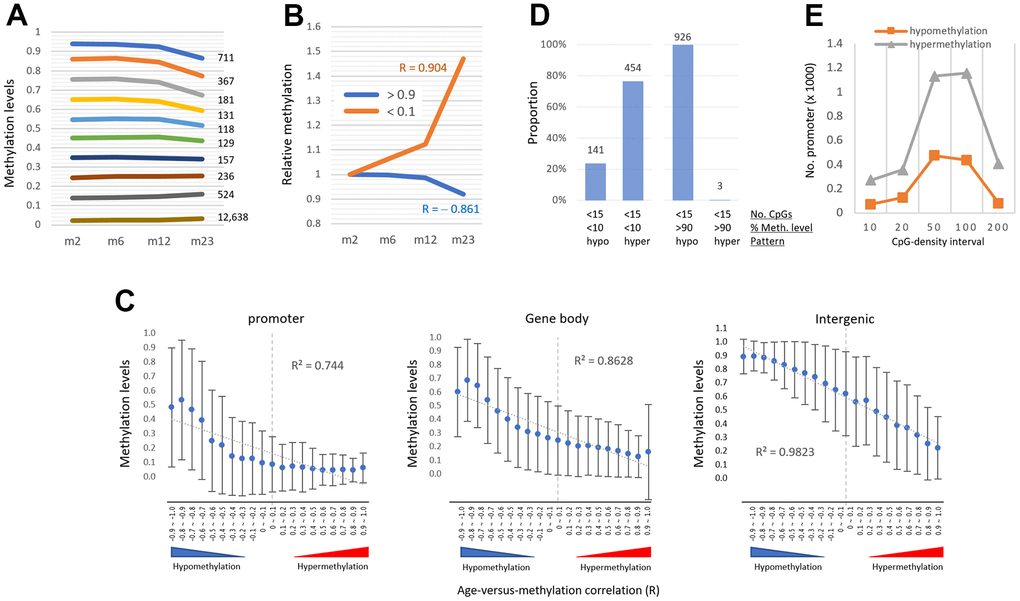
Figure 4.The pattern of age-associated methylation drift is determined by regional methylation level. (A) Relationship of age-linked methylation change pattern with regional methylation level. Promoters were categorized based on their methylation levels (0.1 intervals of β-values, y-axis) as indicated in different colored lines with their counts. (B) Changes in relative methylation levels in promoters with low methylation (<10%, orange) and high methylation levels (>90%, blue) as a function of age. R values indicate Pearson correlation. (C) The inverse relationship between the age-versus-methylation correlations (AMR) and the methylation levels of the regions. AMR is a Pearson correlation (R) between regional methylation levels and sample ages, with values approaching +1 and -1 indicating hyper- and hypomethylation, respectively. With the generated AMRs, the areas were grouped (0.1 intervals, totaling 20 intervals ranging from -1.0 to +1.0) and their mean methylation levels (± standard deviation) at two months of age were measured. The R2 value on the plot is the determination coefficient between methylation levels and AMRs. (D) Prevalence of hypermethylation in promoters with two conflicting variables for age-associated methylation change: low CpG density (<15 ea) favoring hypomethylation, and low methylation level (<10%) favoring hypermethylation (left). Hypomethylation predominates at promoters with both low CpG density and heavy methylation (>90%, right). The regions are counted on the bar. (E) The prevalence of hypermethylation in low-methylation promoters (<10%, n = 13,076), regardless of CpG density.