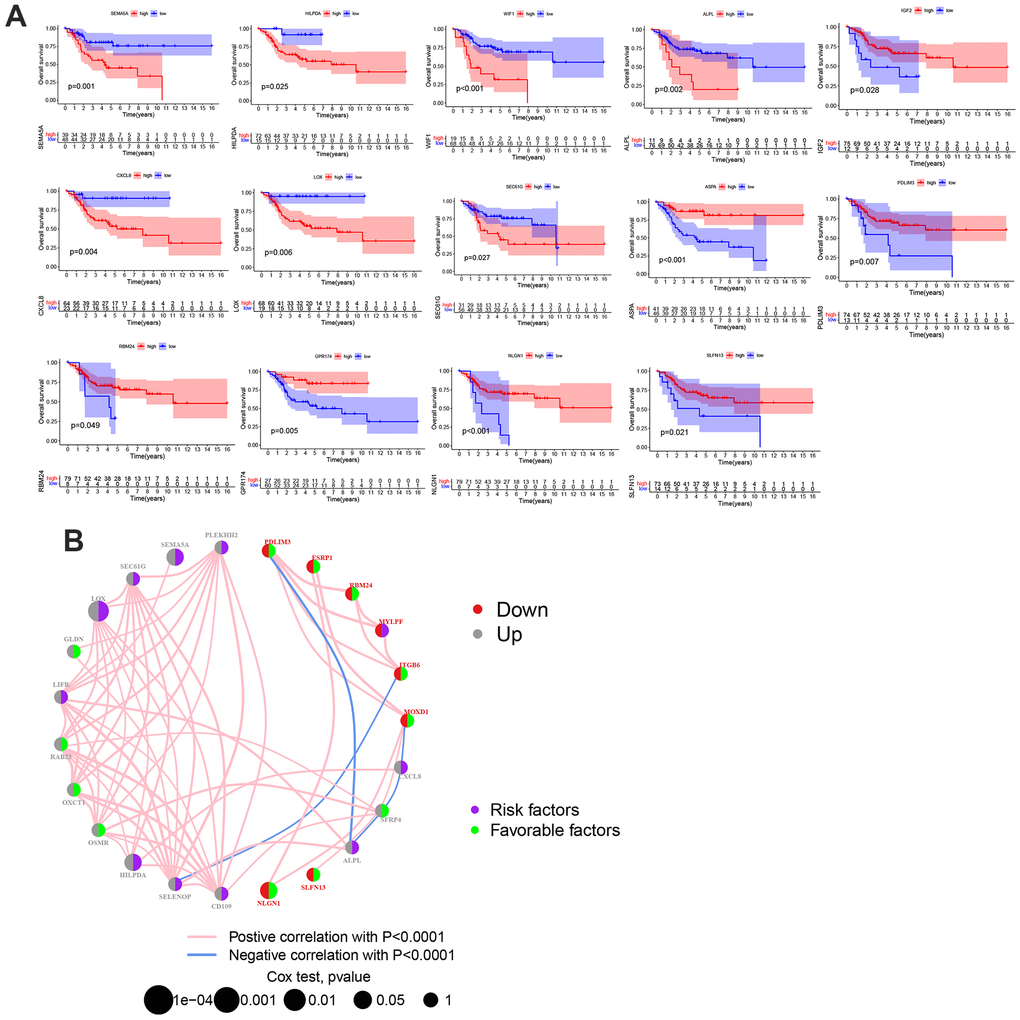
Figure 2.The prognostic value of MRGs in patients with OS. (A) Kaplan-Meier curves for the MRGs in OS patients from TARGET database. (B) A network of correlations including MRGs in the TARGET cohort. (p < 0.05 *; p <0.01 **; p < 0.001 ***).
Figure 2 — Metastasis-related gene signature associates with immunity and predicts prognosis accurately in patients with osteosarcoma | Aging