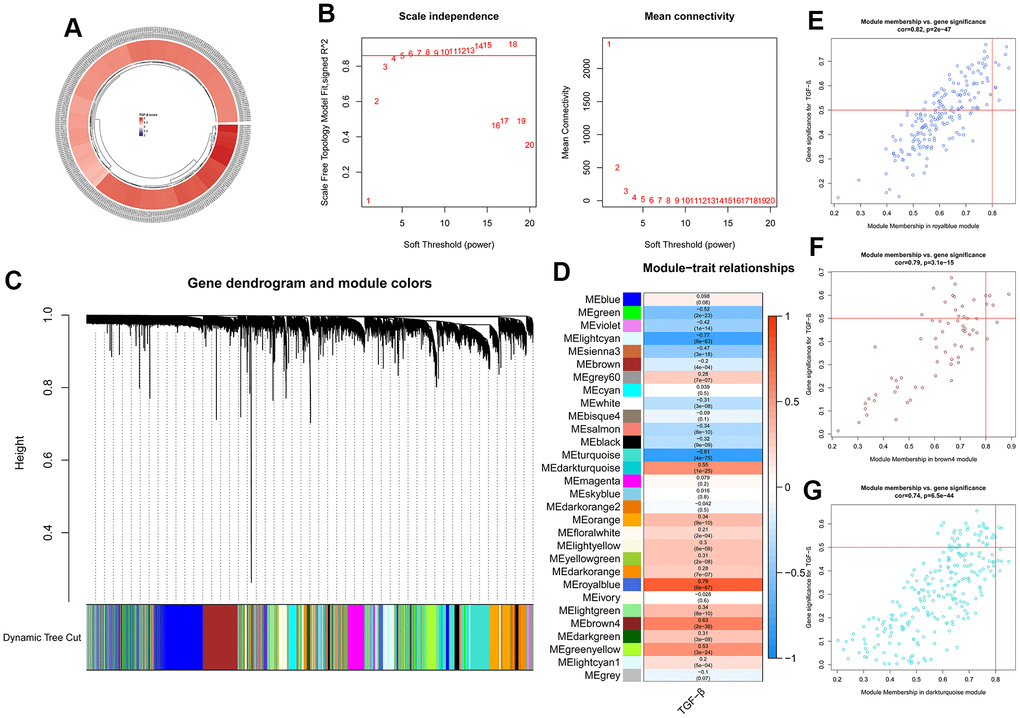
Figure 5.ssGSEA and WGCNA results. (A) Circular heatmap showing the TGF-β scores of 313 samples calculated using ssGSEA. (B) Analysis of the network topology for various soft-thresholding powers. (C) Clustering dendrogram of genes. (D) Heatmap showing the correlation between modules and TGF-β scores. (E–G) Three gene modules selected for further analysis.