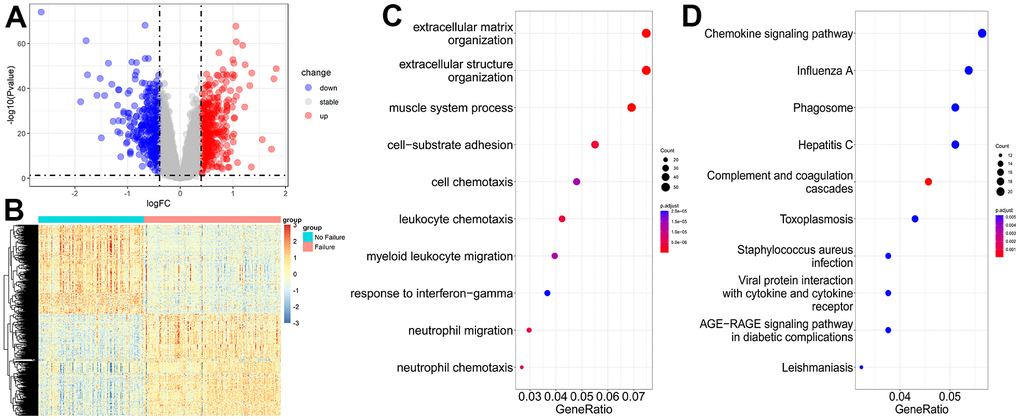
Figure 4.Transcriptome data analysis for heart failure. (A) Volcano plot of DEGs for no failure and heart failure samples. (B) Heatmap of DEGs for no failure and heart failure samples. (C, D) GO and KEGG enrichment analyses of DEGs for no failure and heart failure samples.