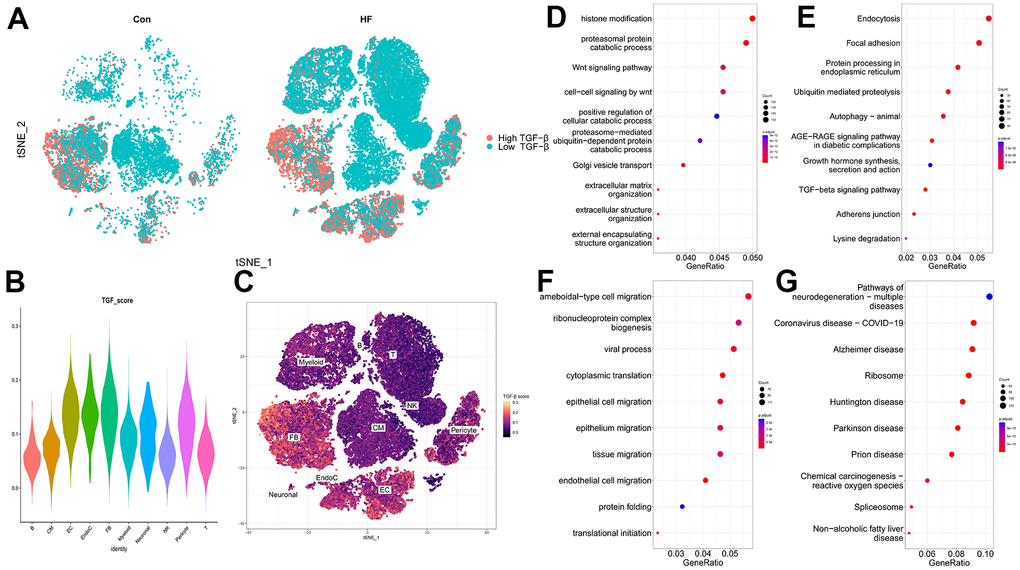
Figure 3.TGF-β score heart failure cell clusters. (A) t-SNE plot showing the high and low TGF-β activity in the control and heart failure samples. (B) TGF-β score for each cell cluster. (C) Heatmap showing the TGF-β activity. (D, E) GO and KEGG enrichment analyses of DEGs for CFs. (F, G) GO and KEGG enrichment analyses of DEGs for ECs.