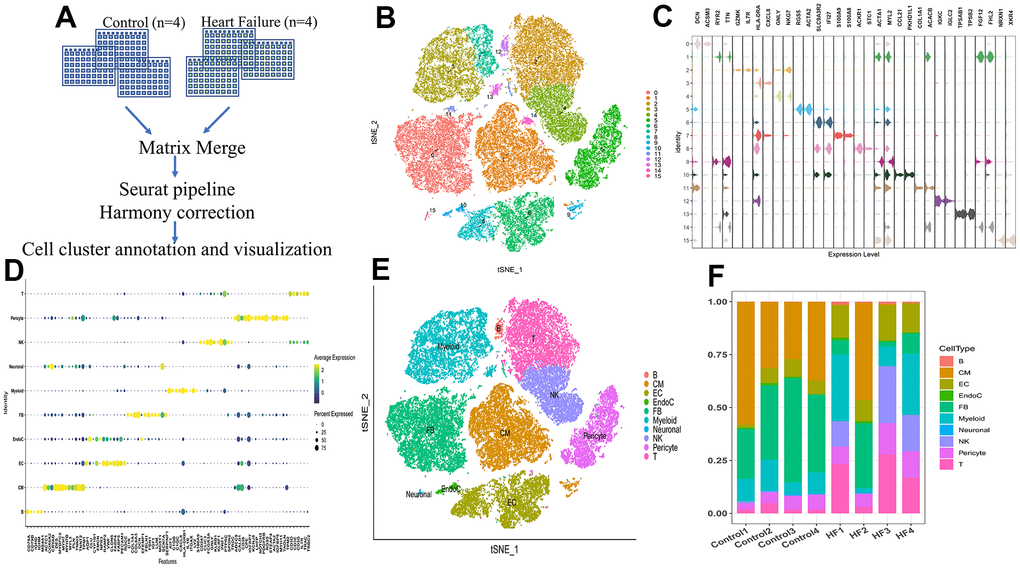
Figure 2.Single-cell RNA sequencing shows the heterogeneity of the heart tissue. (A) Pipeline of single-cell RNA sequencing data processing. (B) t-SNE plot representing the 15 clusters across 39,995 cells from four controls and four heart failure samples. (C) Violin plots showing the expression of marker genes for the 15 cell clusters. (D) Dot plot showing the expression of the top five DEGs in each cell type. (E) t-SNE plot representing the 10 cell clusters after annotation. B, B cells; CM, cardiac muscle cells; EC, endothelial cells; EndoC, endocardial endothelial cells; FB, fibroblasts; myeloid, myeloid cells; neuronal, neurogenic cells; NK, natural killer cells; T, T cells. (F) Bar plot showing the proportion of cell types in each sample.