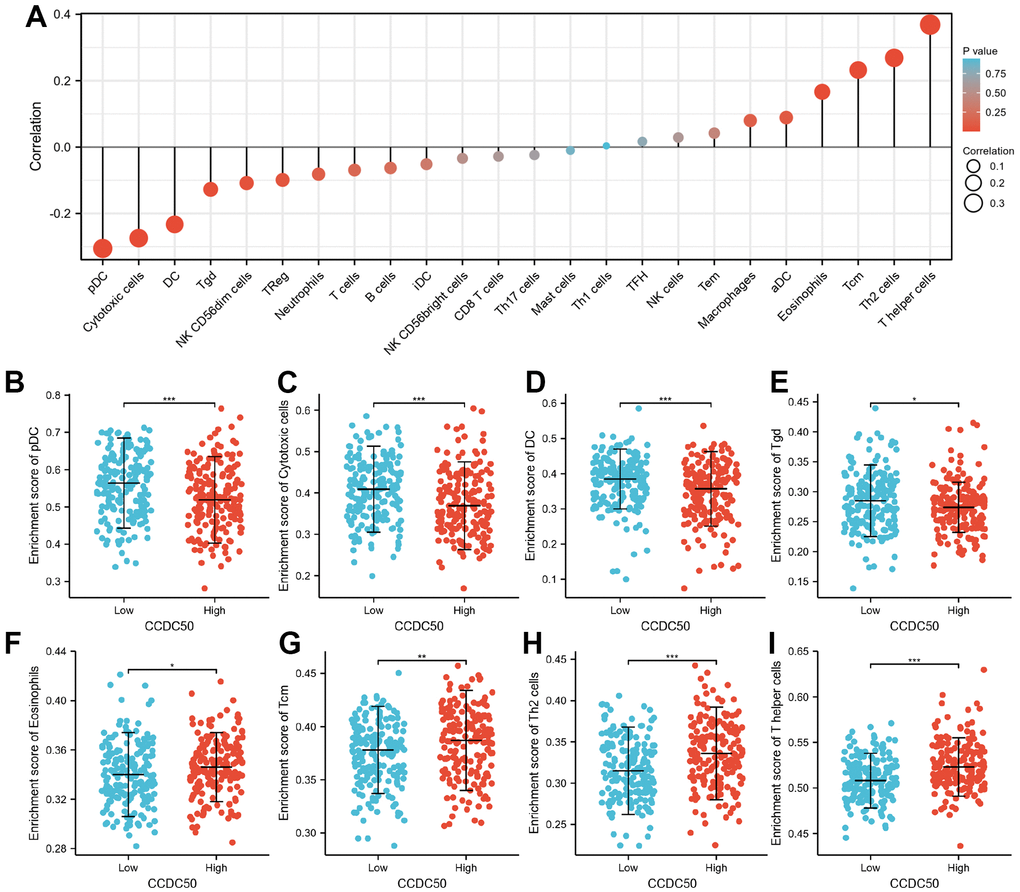
Figure 9.The correlation between CCDC50 expression and the level of immune cell infiltration. (A) The correlation between CCDC50 expression and the level of immune cell infiltration in HCC by using the TIMER database. (B–I) The correlations between CCDC50 expression and the level of pDC, Cytotoxic cells, DC, Tgd, Eosinophils, Tcm, Th2, and T helper cells. *p < 0.05, **p < 0.01, ***p < 0.001.