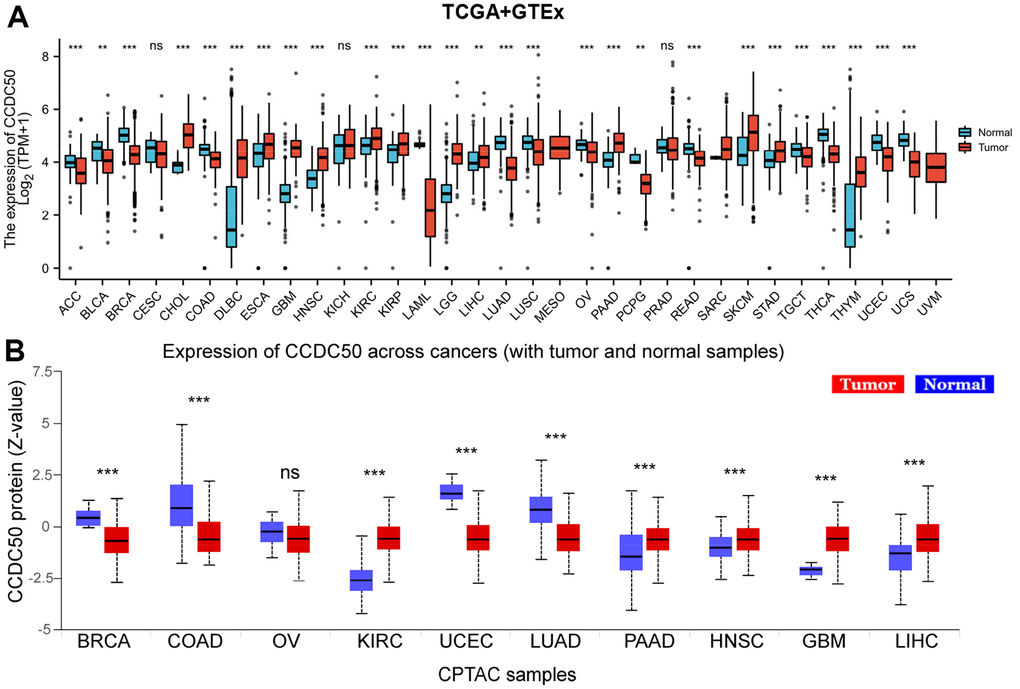
Figure 1.CCDC50 mRNA and protein expressions between tumour and normal tissues. (A) The CCDC50 expression in pan-cancer analysis via the TCGA/GTEx databases. (B) The protein of CCDC50 in pan-cancer analysis from CPTAC samples via the UALCAN web-portal. Z-values represent standard deviations from the median across samples for the given cancer type. ns, p > 0.05; *p < 0.05; **p < 0.01; ***p < 0.001.