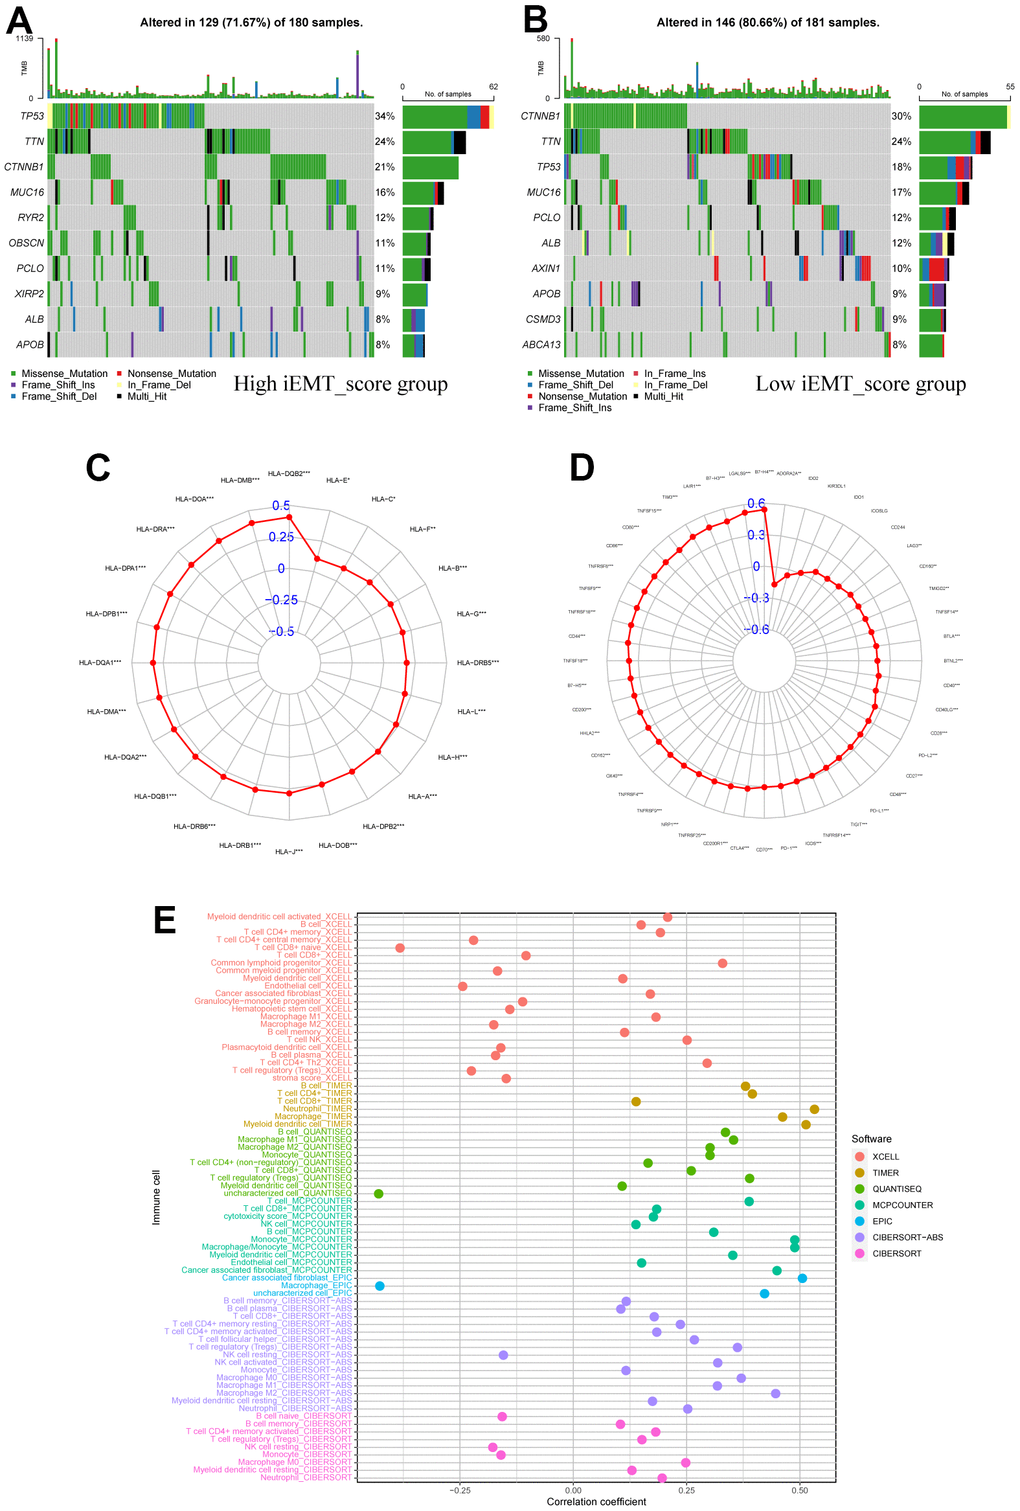
Figure 5.Immunological properties of different iEMT_score subgroups. (A) Top 10 mutation-prone genes in High iEMT_score group. (B) Top 10 mutation-prone genes in Low iEMT_score group. (C) Correlation between iEMT_score and expression of 48 immune checkpoint molecules. (D) Correlation between iEMT_score and 24 HLA family gene expressions. (E) Correlation analysis between iEMT_score and immune cell infiltration.