Submit an Article
Navigate
Home
Editorial Board
Editorial Policies
Current Volume
Archive
Scientific Integrity
Publication Ethics Statements
Interviews with Outstanding Authors
Newsroom
Sponsored Conferences
Podcast
Contact
Special Collections
Submit an Article
Online ISSN: 1945-4589
Research Paper
|
Volume 15, Issue 14
|
pp. 7146–7160
Combining WGCNA and machine learning to construct immune-related EMT patterns to predict HCC prognosis and immune microenvironment
Back to article
Figure 4
(4 of 7)
−
100%
+
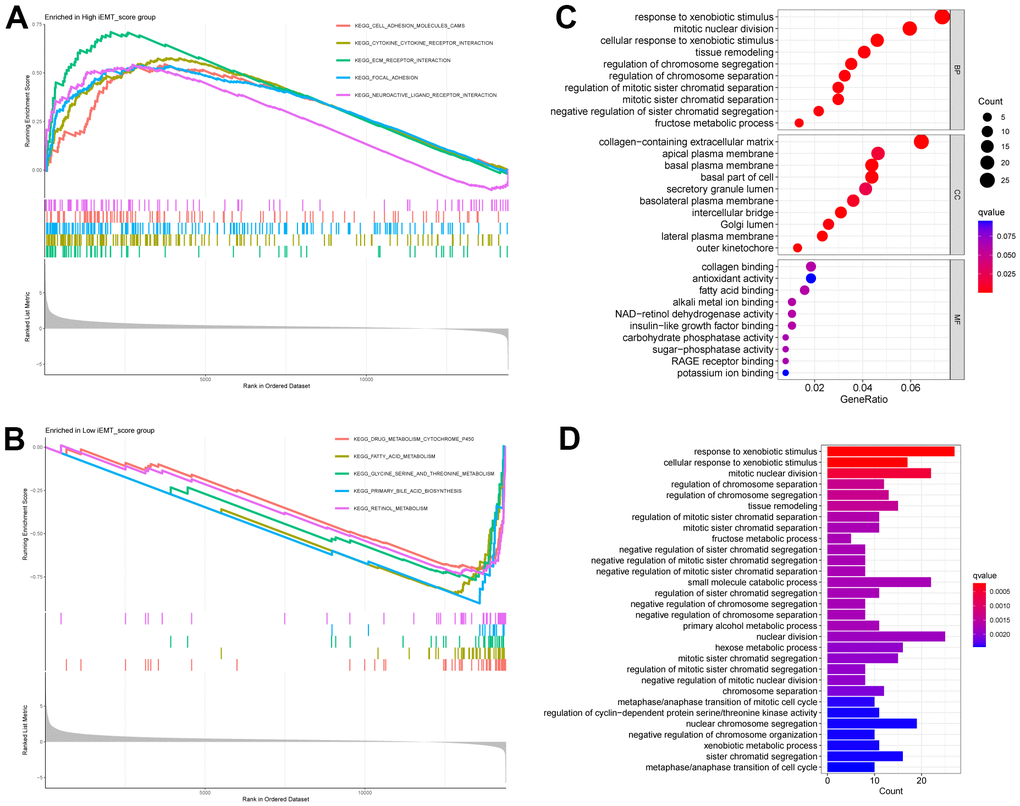
Figure 4.
GSEA of different iEMT_score subgroups.
(
A
) Signaling pathways enriched by High iEMT_score group. (
B
) Signaling pathways enriched by Low iEMT_score group. (
C
) GO analysis for DEGs. (
D
) KEGG analysis for DEGs.