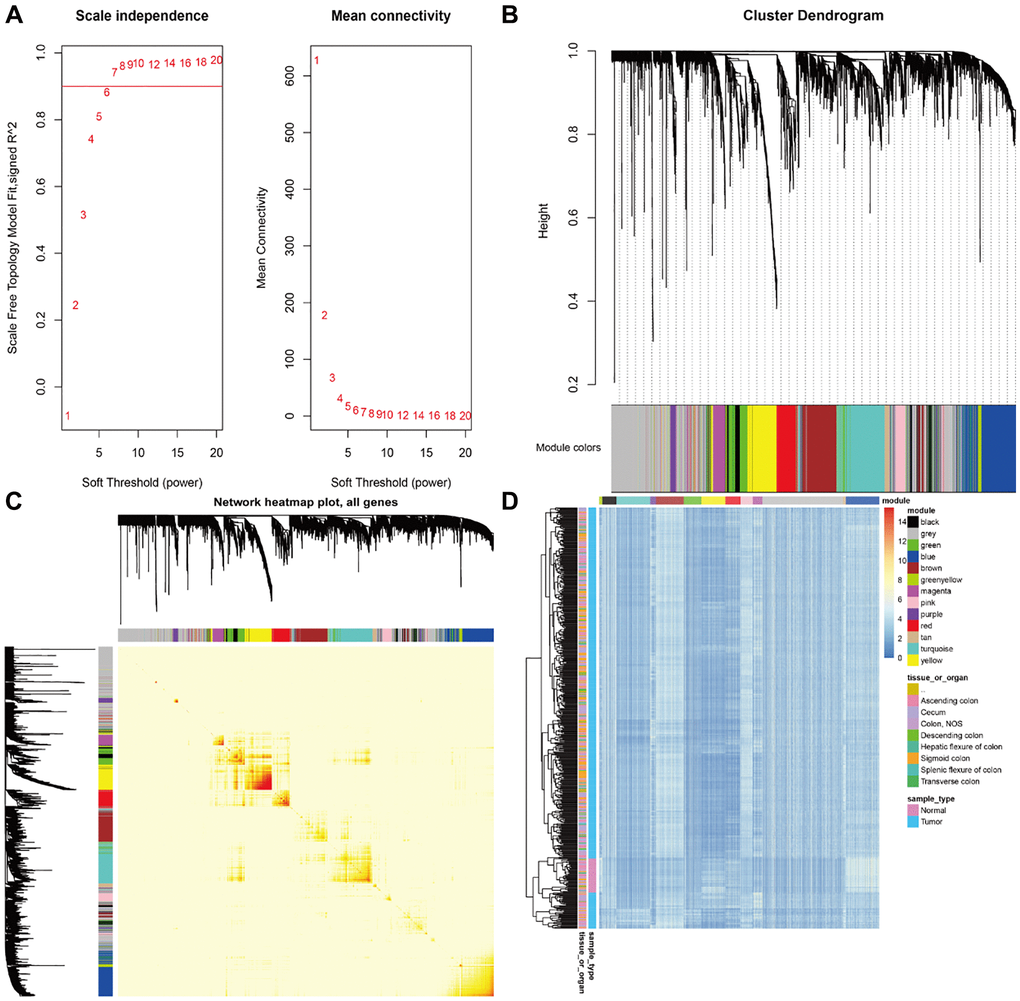
Figure 2.(A) The network parameter selection. (B) The cluster dendrogram of the differentially expressed genes. (C) Identification of modules associated with the clinical traits. Interaction relationship analyses of co-expression genes. Different colors of horizontal axis and vertical axis represent different modules. The brightness of yellow in the middle represents the degree of connectivity of different modules. There was no significant difference in interactions among different modules, indicating a high-scale independence degree among these modules. (D) The samples were mainly divided into two clusters according to the gene expression in the gene modules.