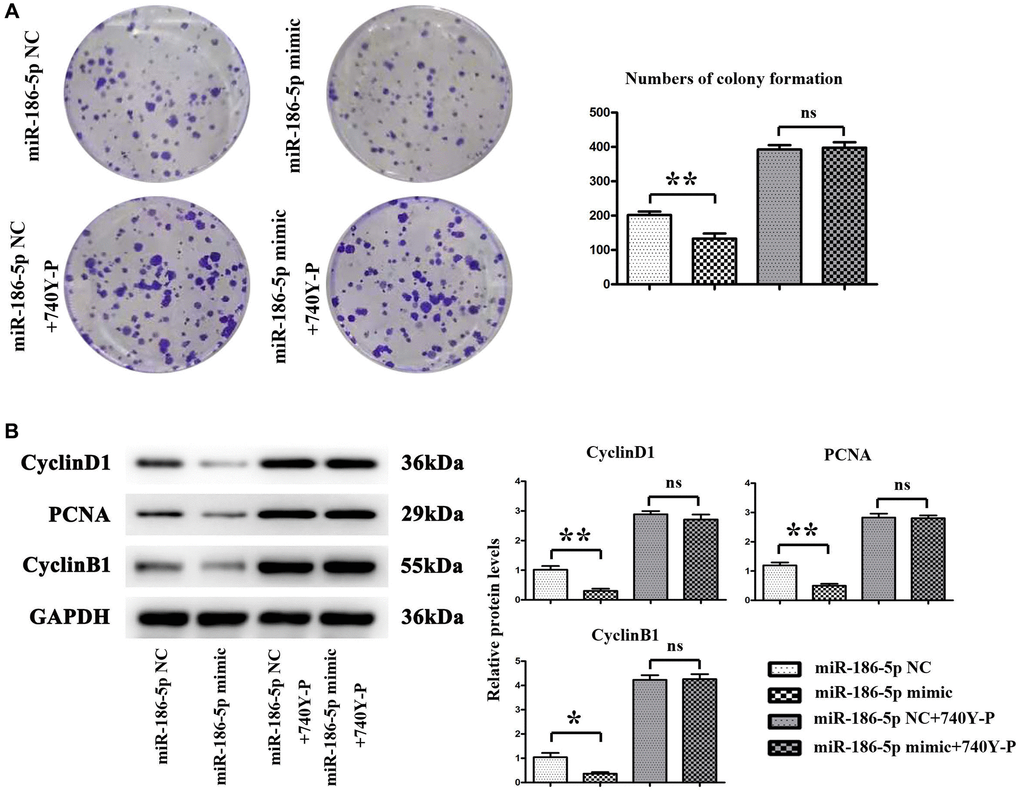
Figure 7.Proliferation of MDA-MB-231 cells in each group. (A) Changes in the number of colonies formed by mDA-MB-231 cells; (B) Protein expression levels of CyclinA2, CyclinD1 and PCNA in MDA-MB-231 cells. *P < 0.05 and **P < 0.01 indicated statistically significant differences.