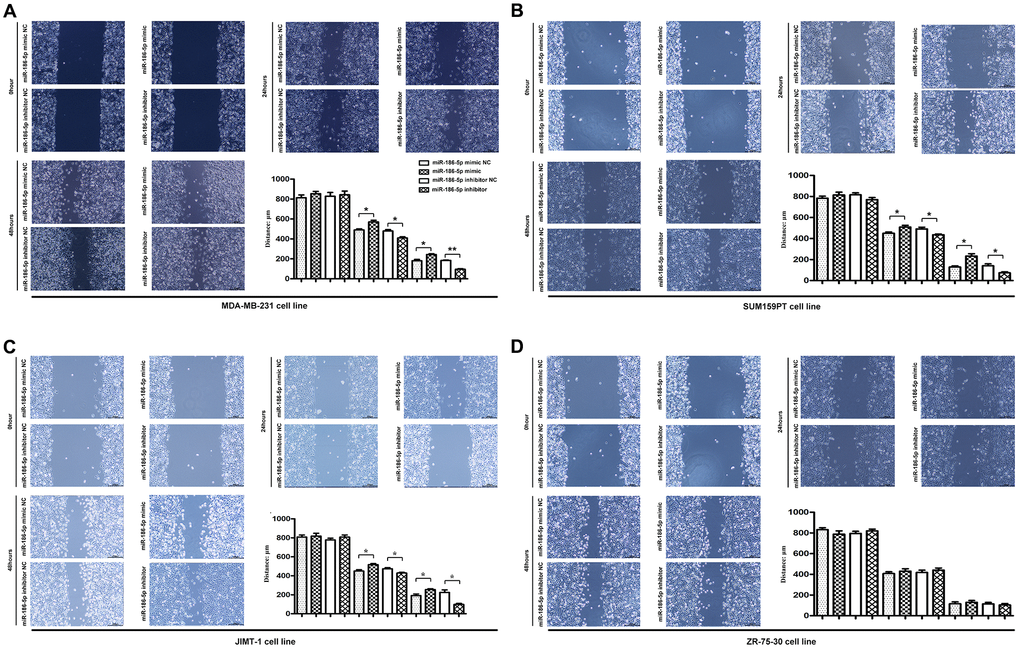
Figure 4.Scratch assay was used to detect the migration ability of MDA-MB-231, SUM159PT, JIMT-1, but not ZR-75-30 cells in each group. (A–D) showed the image of the migration area 0 h, 24 h and 48 h after the scratch manufacturing, respectively. Statistical results of scratch distance of MDA-MB-231 cells in each group. *P < 0.05 and **P < 0.01 indicated statistically significant differences.