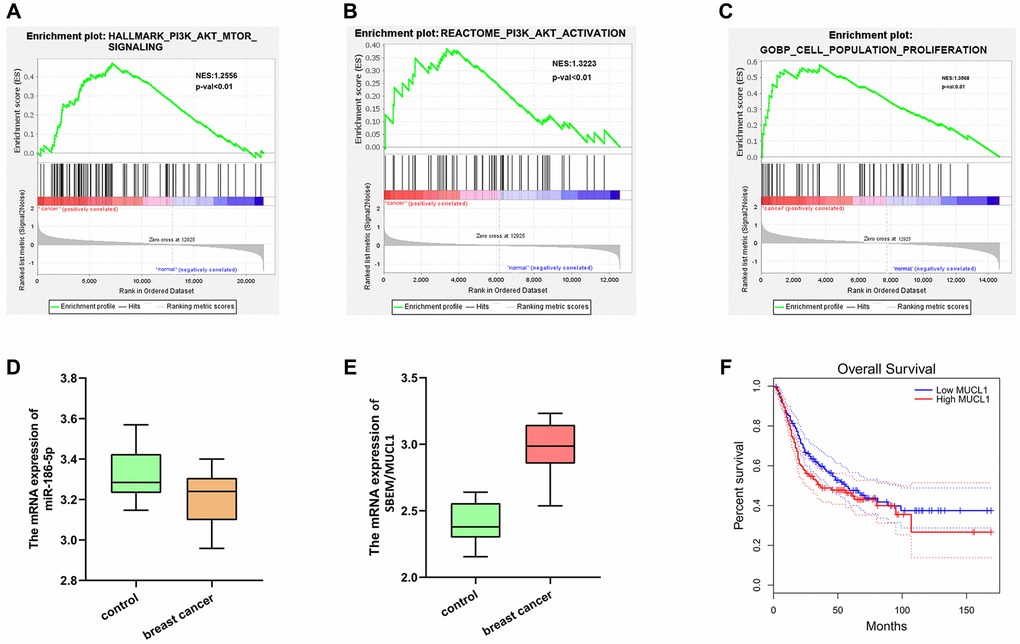
Figure 3.GSEA analysis and target gene statistical analysis. (A–C) GSEA analysis showed that the PI3K-Akt-MTOR signaling pathway and cell proliferation pathway were enriched; (D) Low expression of Mir-186-5p in breast cancer; (E) High expression of SBEM (MUCL1) in breast cancer; (F) Survival curve plotted with low survival associated with high expression of SBEM.