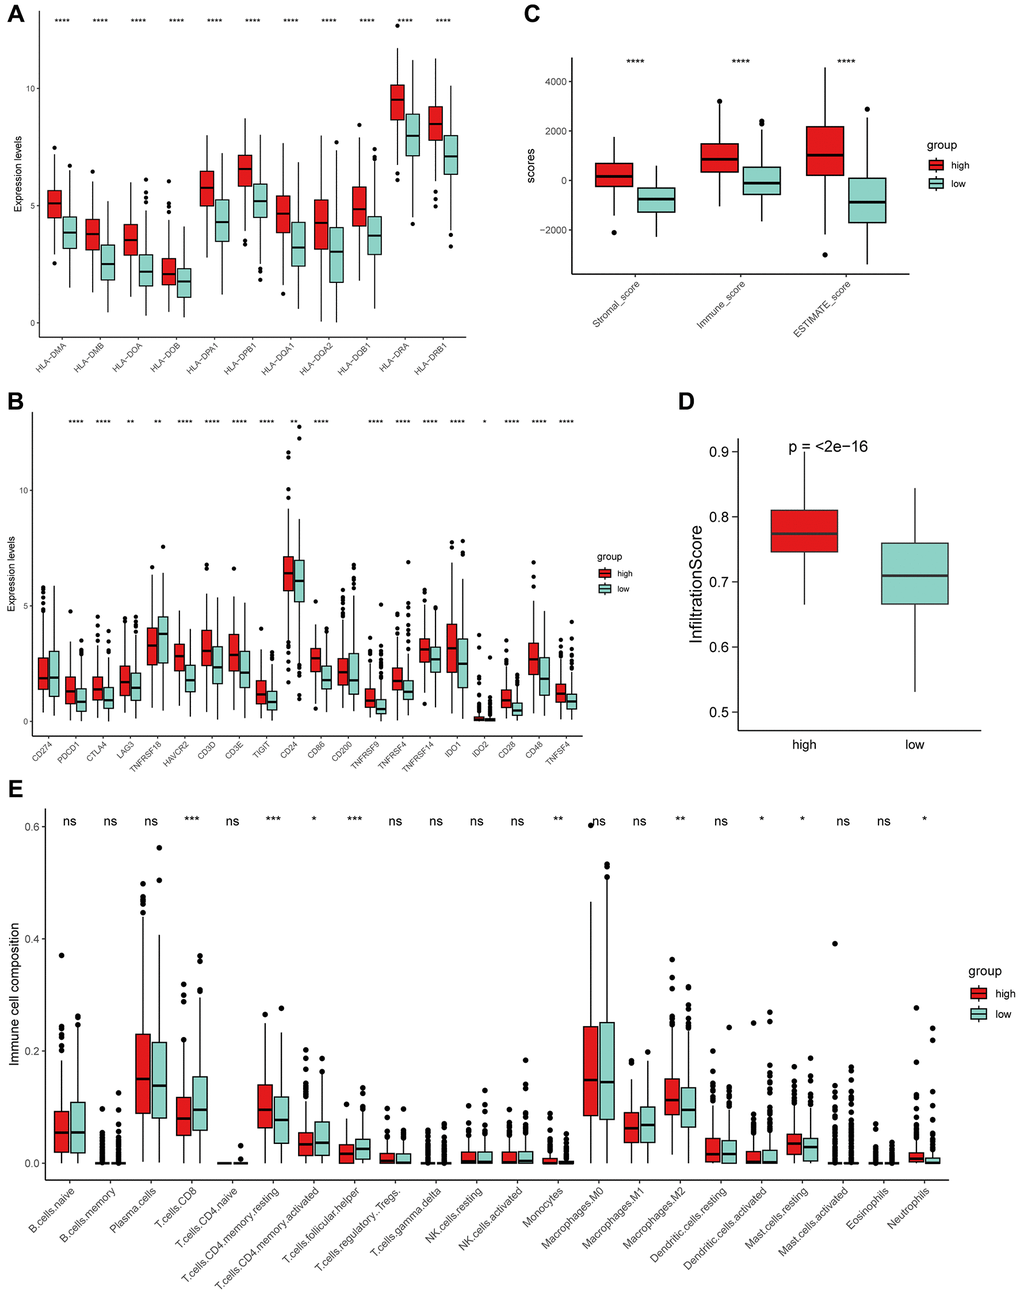
Figure 6.The exploration of PRS and tumor microenvironment (TME). (A) MHC-II molecules were highly expressed in high PRS patients. (B) Similarly, almost all immune checkpoints (ICs) were highly expressed in high PRS patients. Boxplot showed the high PRS patients had significantly higher infiltration levels of TME using ESTIMATE (C) and ImmuCellAI (D) algorithm. (E) Two types of PRS patients exhibited distinct immune cell populations. Wilcoxon test, *P < 0.05, **P < 0.01, ***P < 0.001, ****P < 0.0001 and ns represents not significant.