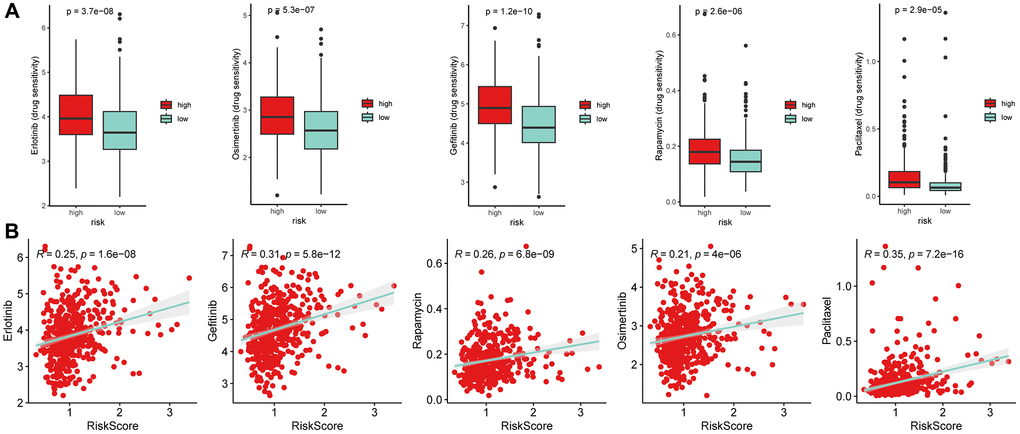
Figure 12.Drug susceptibility analysis. (A) The half maximal inhibitory concentration (IC50) values of several anti-tumor drugs (Erlotinib, Osimertinib, Gefitinib, Rapamycin, and Paclitaxel) (Wilcoxon test). (B) The Spearman correlation analysis of risk scores with these drugs. The results showed that high-risk subgroups were resistance to the five drugs.