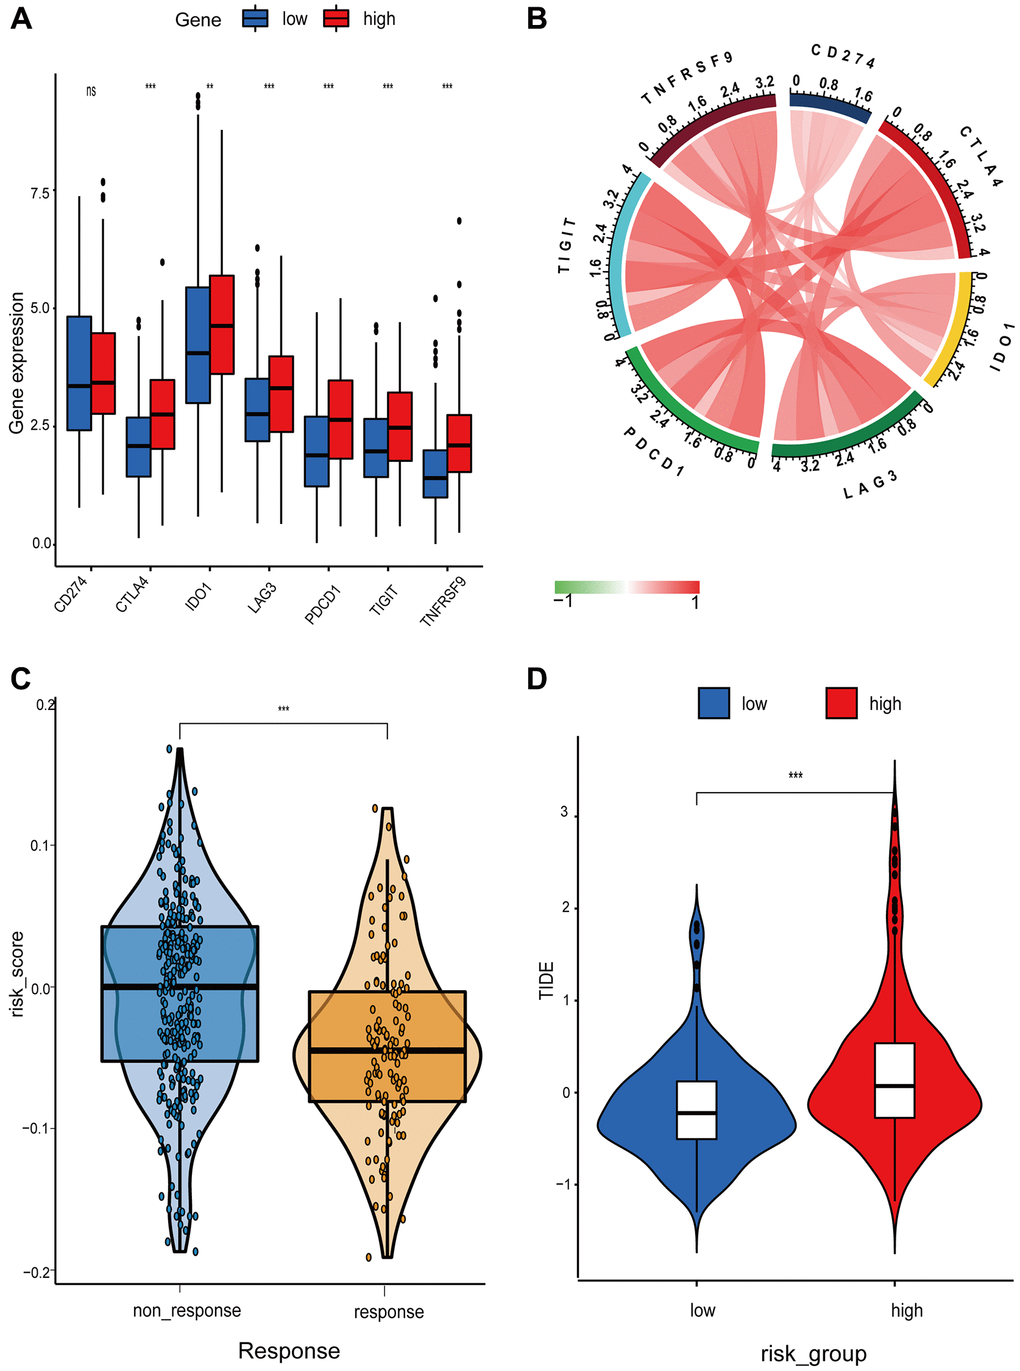
Figure 6.Differential analysis of immune checkpoint and risk score between high- and low-risk groups. (A) Boxplot showing differential expression of common immune checkpoint between high- and low-risk groups. (B) Chord diagram illustrating the relationship between the immune checkpoints. (C and D) Comparison of the immunotherapy response between high- and low-risk groups.