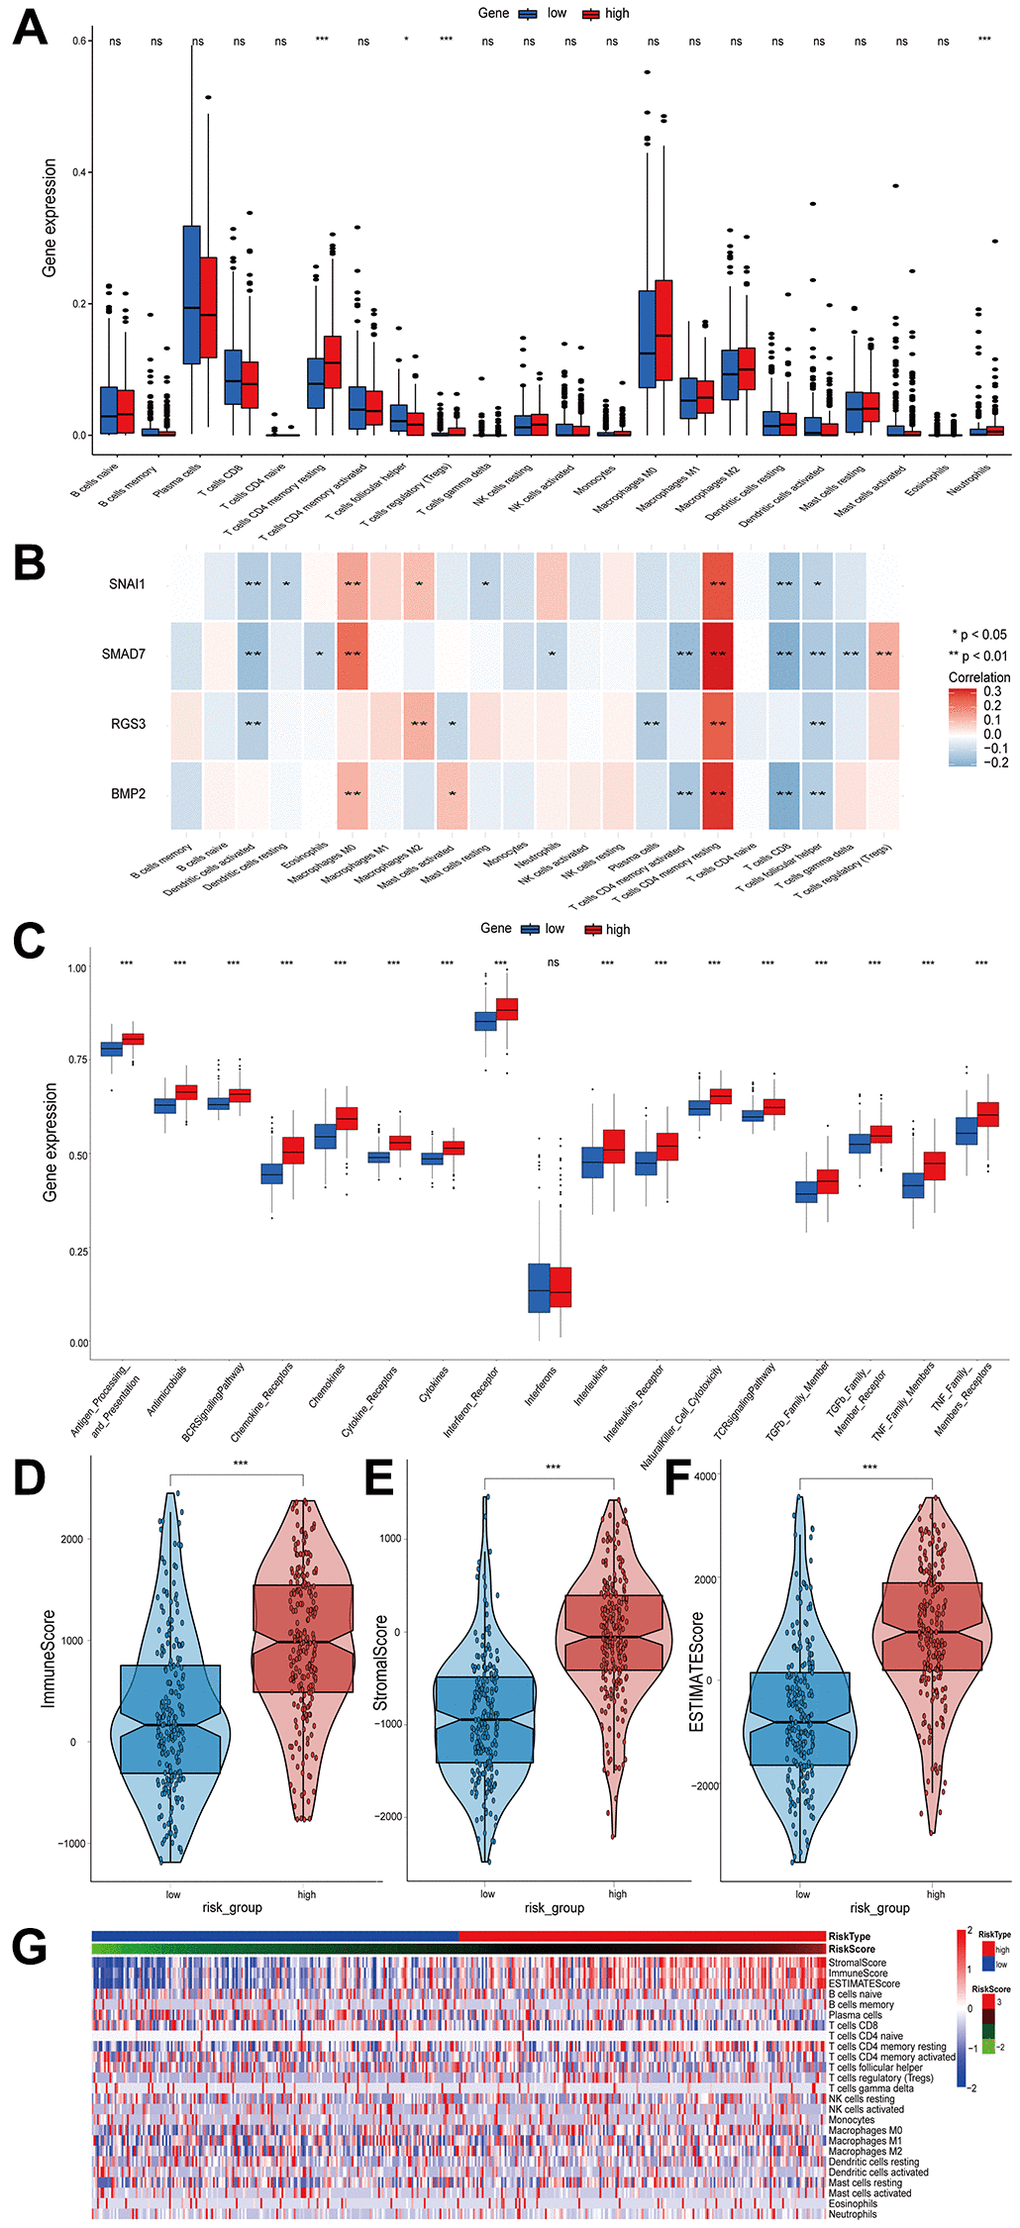
Figure 5.The relationship between the infiltrated immune cells and risk score and the difference in immune score and immune pathways between high- and low-risk groups. (A) Comparison of the infiltration level of 22 tumor-infiltrating immune cells between the high- and low-risk groups. (B) The correlation heatmap between 22 immune cells and EMT-RDGs. (C) Box plots showing the immune pathways analysis between high- and low-risk groups. (D–F) Boxplots of the immune score, stromal score, and ESTIMATE score. (G) Heatmap of immune cells and ESTIMATE score for high- and low-risk groups.