Submit an Article
Navigate
Home
Editorial Board
Editorial Policies
Current Volume
Archive
Scientific Integrity
Publication Ethics Statements
Interviews with Outstanding Authors
Newsroom
Sponsored Conferences
Podcast
Contact
Special Collections
Submit an Article
Online ISSN: 1945-4589
Research Paper
|
Volume 15, Issue 16
|
pp. 7956–7973
A novel telomere-related gene prognostic signature for survival and drug treatment efficiency prediction in lung adenocarcinoma
Back to article
Figure 8
(8 of 8)
−
100%
+
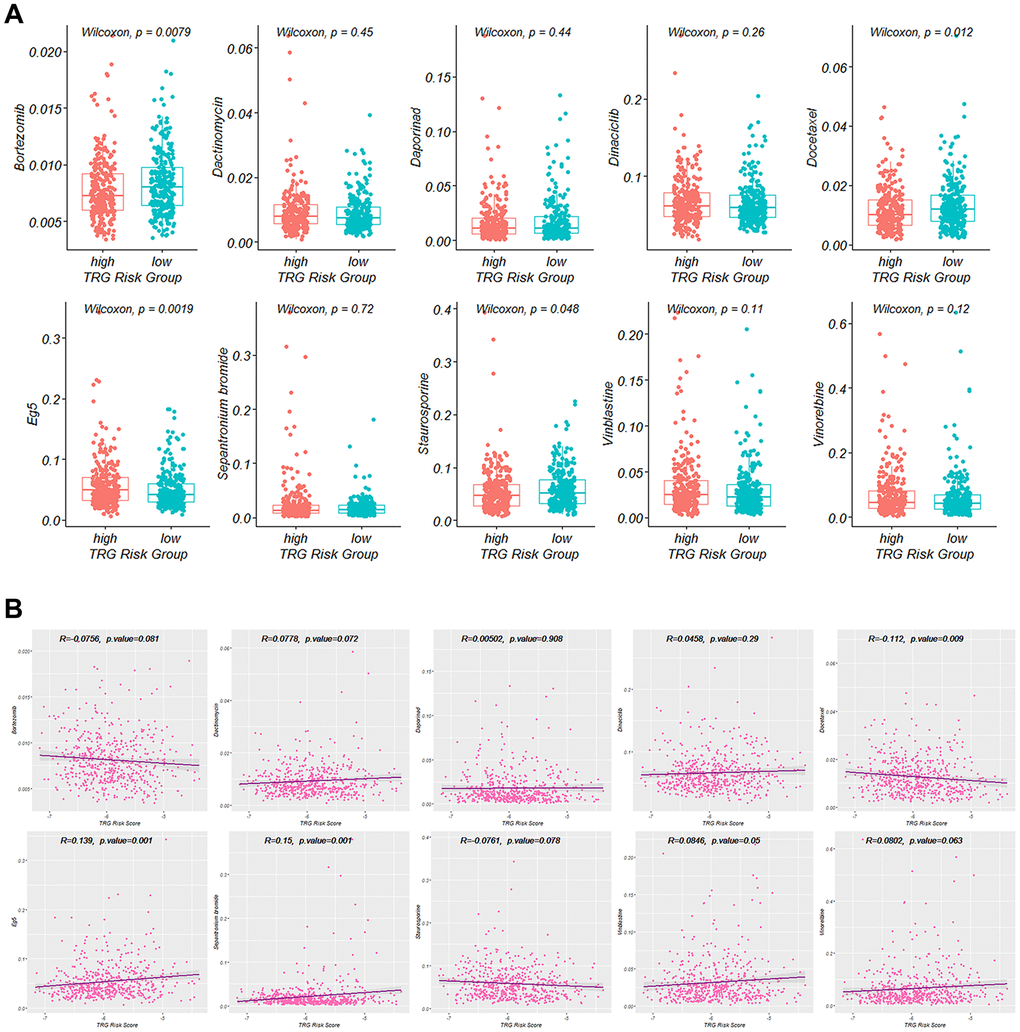
Figure 8.
Targeted agents’ treatment sensitivity.
(
A
) and (
B
) Correlation of the IC50 value of the selected ten drugs with TRG risk score.
Figure 8 — A novel telomere-related gene prognostic signature for survival and drug treatment efficiency prediction in lung adenocarcinoma | Aging