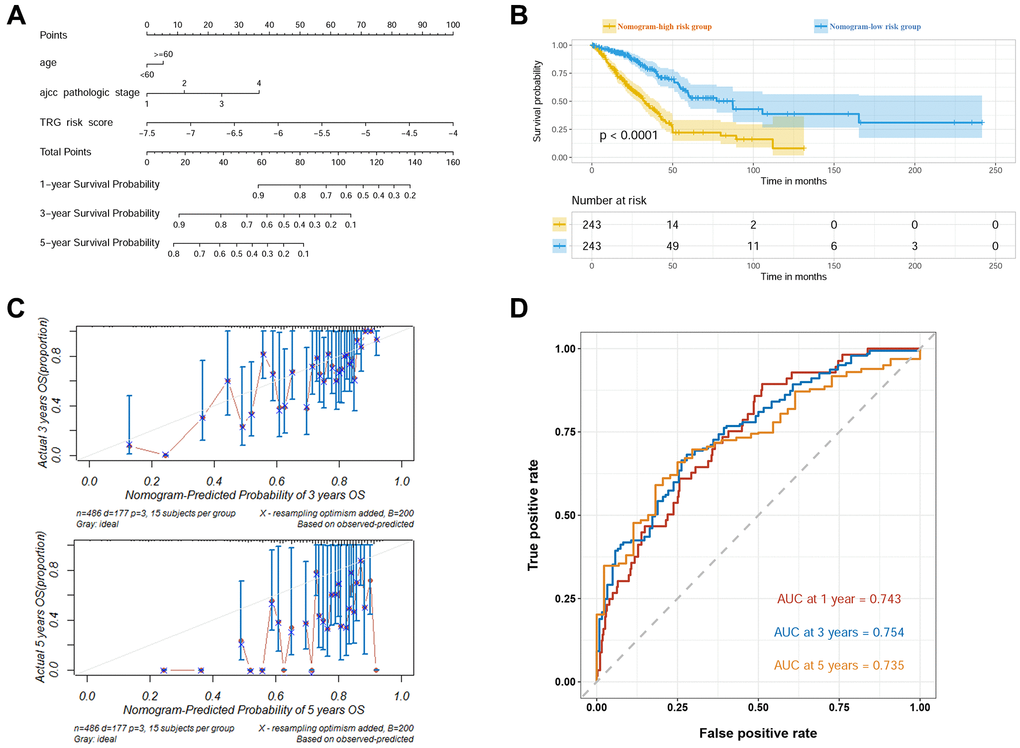
Figure 3.Construction of the prognostic nomogram in TCGA cohort. (A) Visualized nomogram based on age, AJCC stage, and TRG risk score. (B) Survival curves of high and low nomogram risk groups plotted by K-M method. (C) Calibration curves of the nomogram at 3 and 5 years. (D) ROC curves of the nomogram at 1, 3 and 5 years.