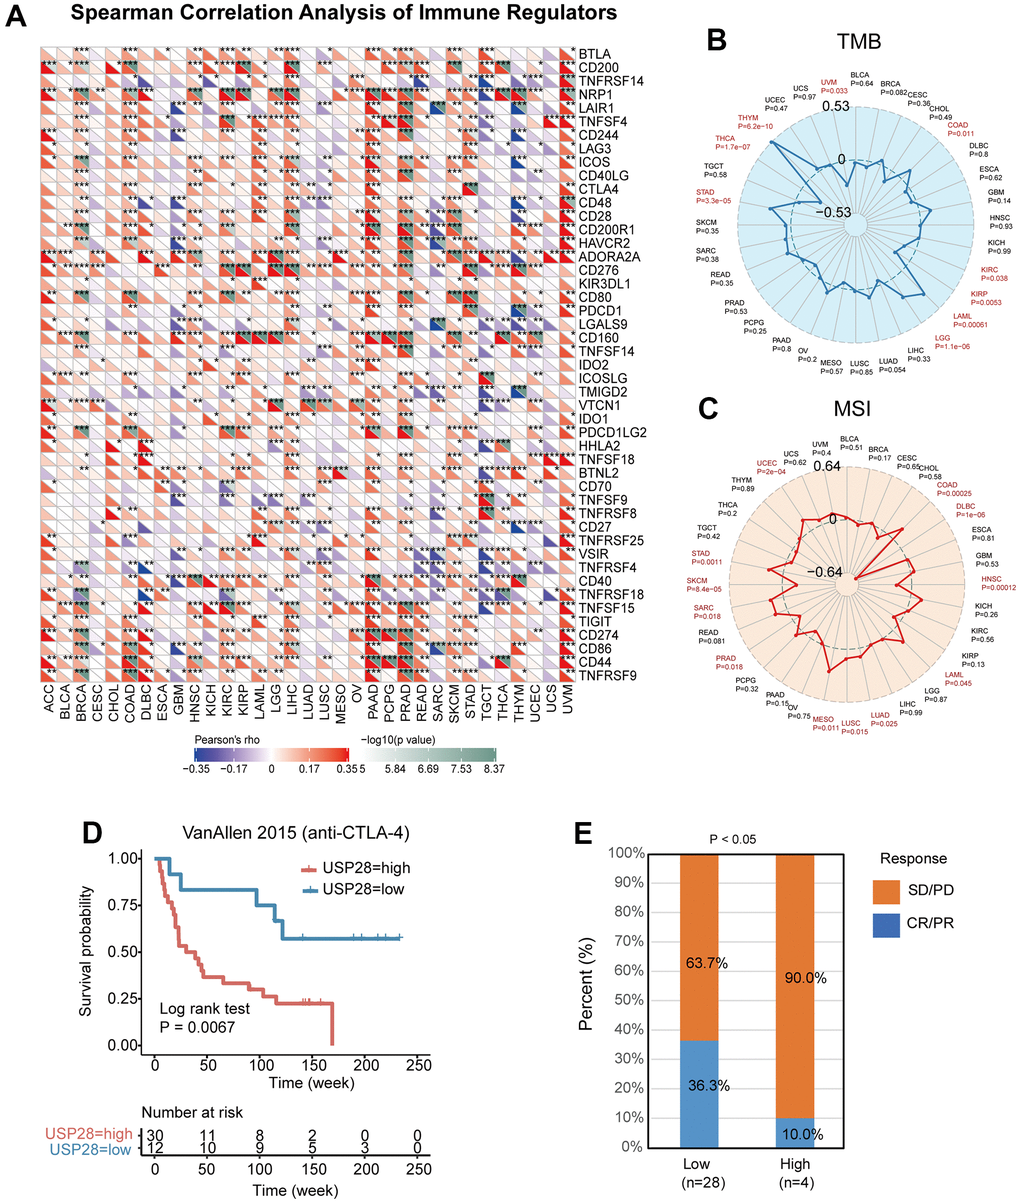
Figure 8.Relationships between USP28 and immune checkpoint genes, TMB, and MSI. (A) Heatmap exhibiting the correlation between USP28 and immune checkpoint gene expression in 33 cancer types from the TCGA database. Spearman’s rank correlation coefficient was used. (B) The association analysis between USP28 expression and tumor mutation burden (TMB) in pan-cancer. (C) The correlation analysis between USP28 expression and microsatellite instability (MSI) in pan-cancer was described. (D) Survival analysis of patients with high (n = 30) and low (n = 12) USP28 expression based on OS data from patients receiving anti-CTLA-4 immunotherapy, (E) and proportions of patients with different therapeutic responses *p < 0.05; ** p < 0.01; *** p < 0.001.