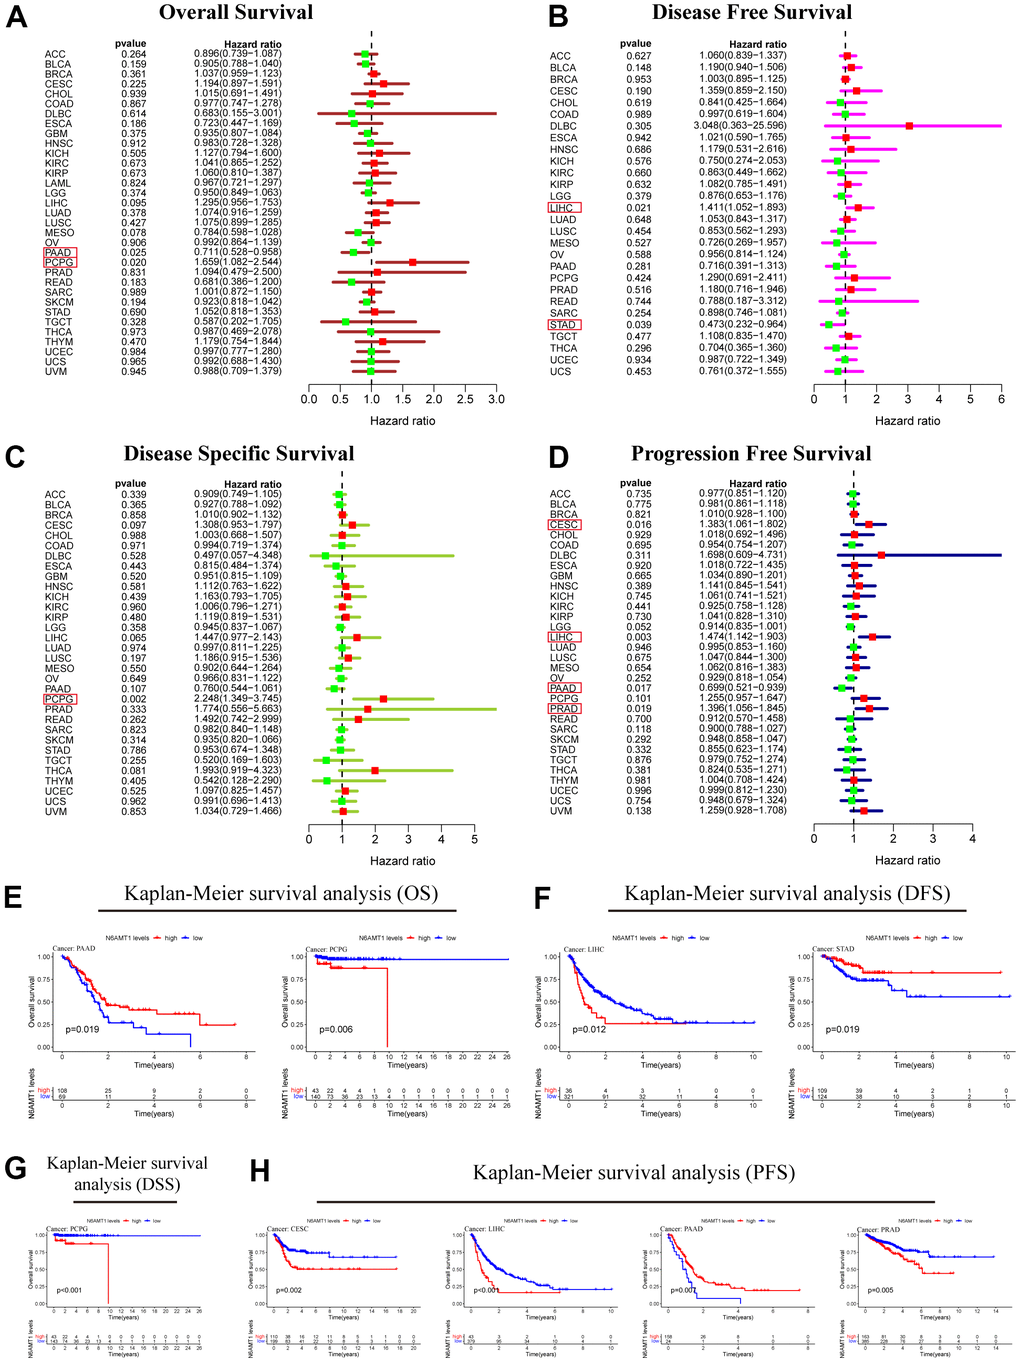
Figure 5.Prognostic analysis of N6AMT1 in pan-cancer. Forest plot showing the results of univariate Cox regression analysis of the correlations between N6AMT1 and OS (A), DFS (B), DSS (C) and PFS (D). (E–H) Kaplan-Meier survival curves of N6AMT1 in cancer types that affect cancer prognosis. p < 0.05 indicates statistical significance.