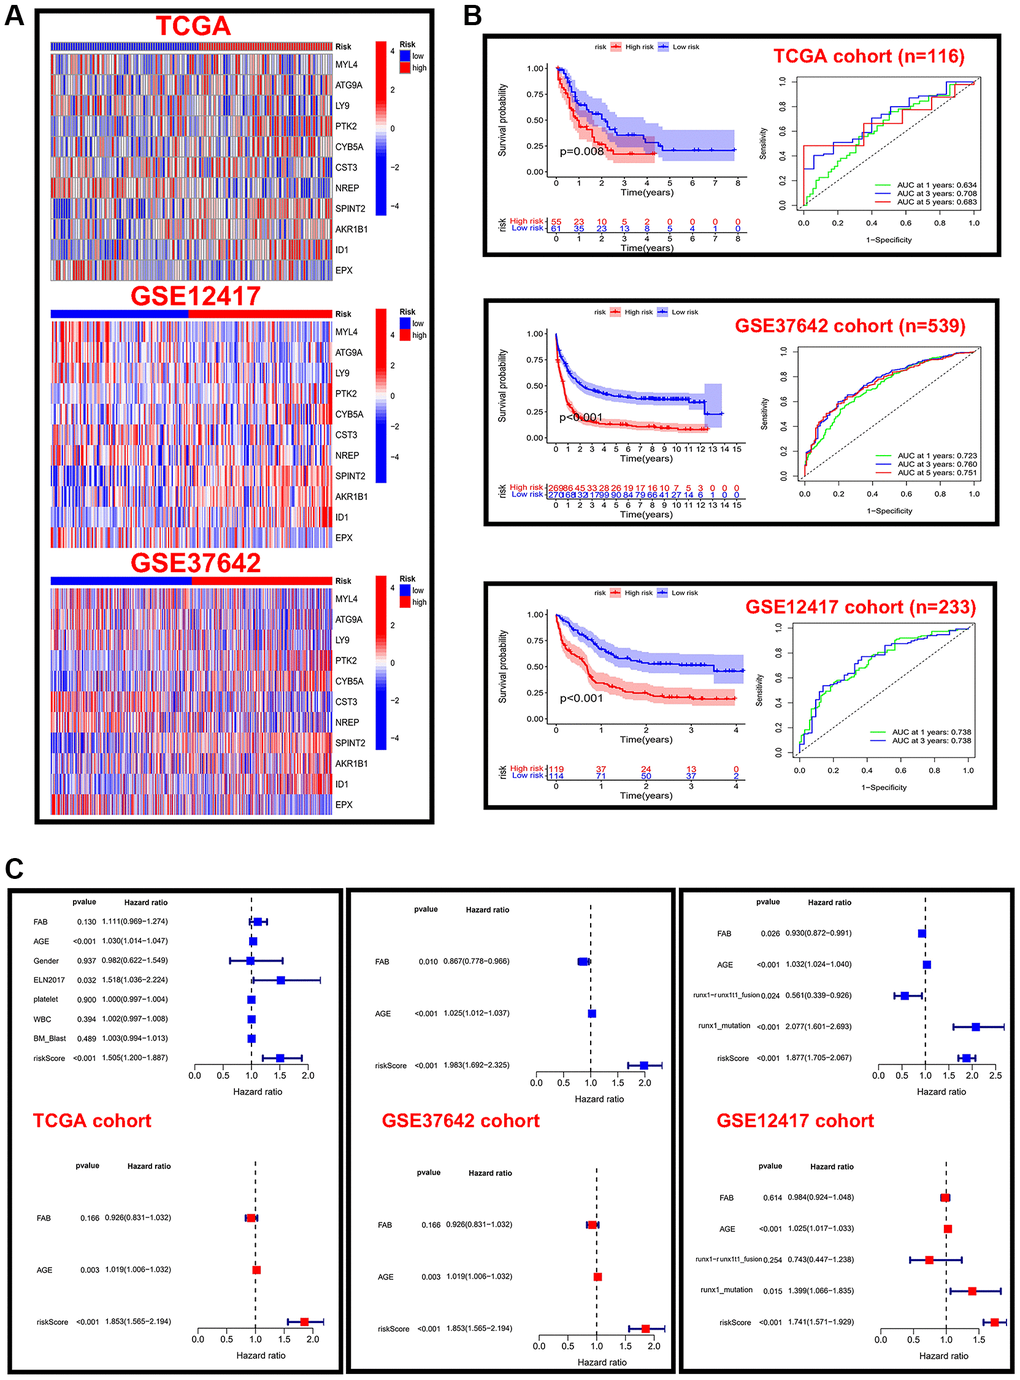
Figure 5.Validation of risk scores in different cohorts. (A) Heat map of 11 prognostic model genes expressed in different risk score groups in the TCGA and GEO cohorts. (B) Kaplan-Meier analysis and time-dependent ROC curve analysis for different risk score groups in the TCGA cohort. (C) Forest plots of independent prognostic factors for univariate and multifactorial Cox analysis in three cohorts.