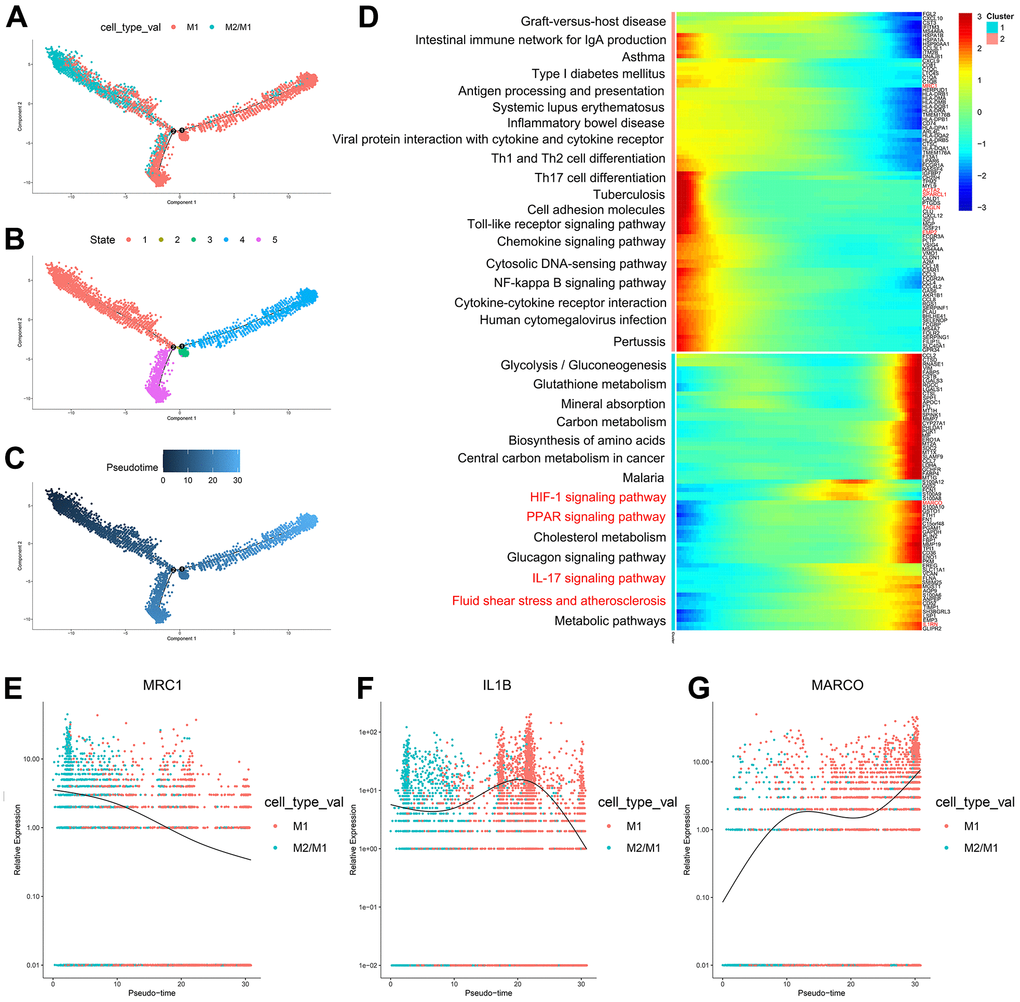
Figure 4.(A–C) Trajectory analysis of M1 macrophages and M2/M1 macrophages. (D) The trajectory analysis of the heatmap of M1 macrophages versus M2/M1 macrophages. The X-axis represents the timeline of trajectory analysis, the left Y-axis represents the KEGG enrichment results, and the right Y-axis represents the differentially expressed genes between the two clusters. (E–G) Pseudotime analysis of genes (MRC1, IL1B, and MARCO). The X-axis represents the cell of trajectory analysis, and the Y-axis represents the relative expression of the gene.