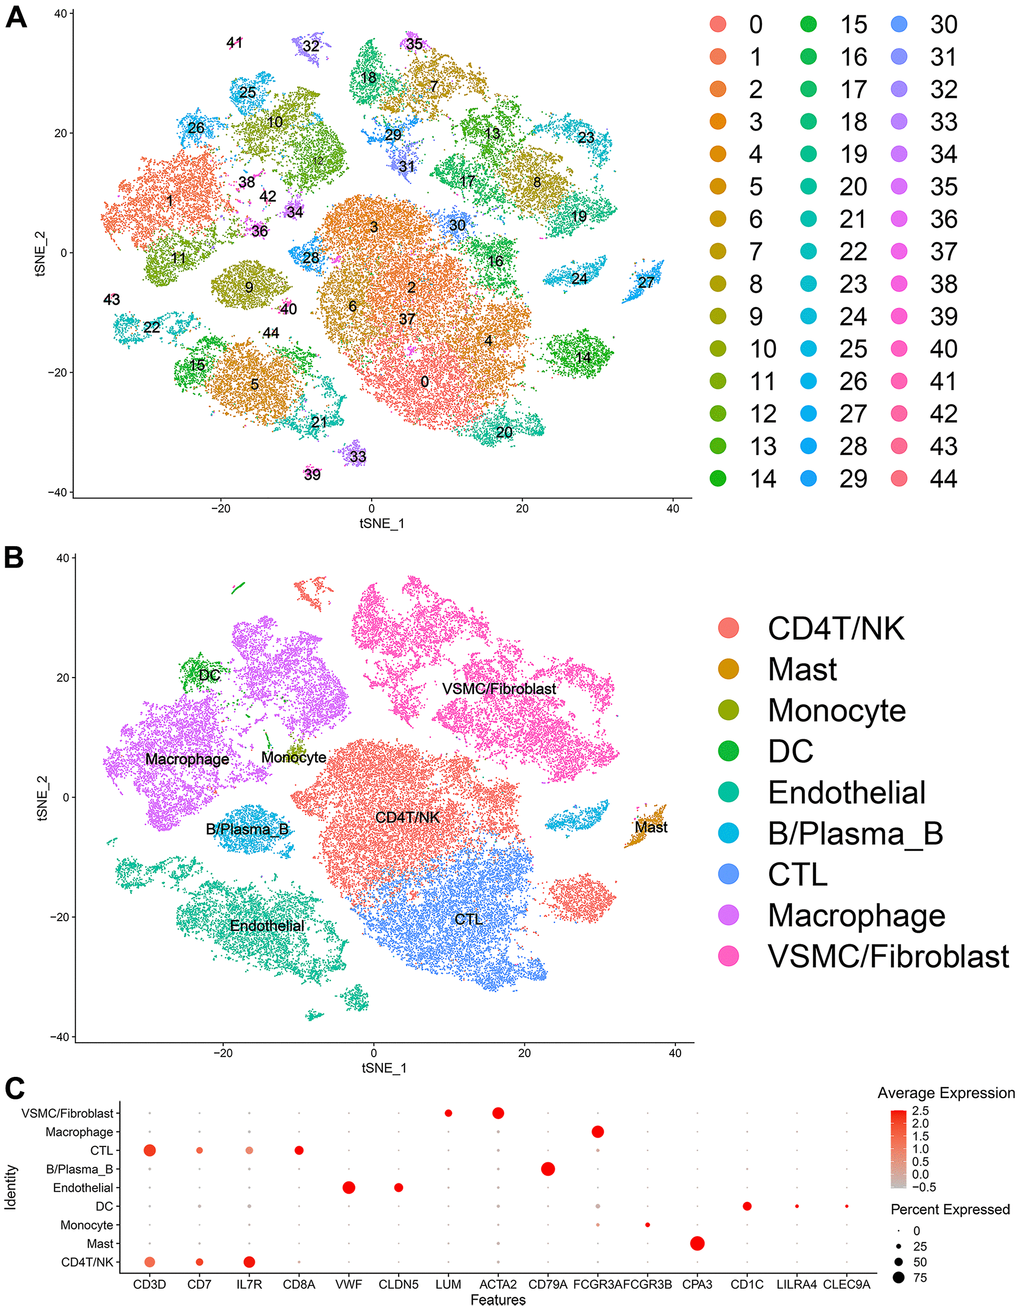
Figure 1.Single-cell transcriptome data: (A, B) The single cells were divided into 45 groups on the basis of their transcriptome data and then ultimately divided into 9 cell populations. (C) Circle chart: The X-axis represents the marker genes that define the cells, and the Y-axis represents the different cell populations.