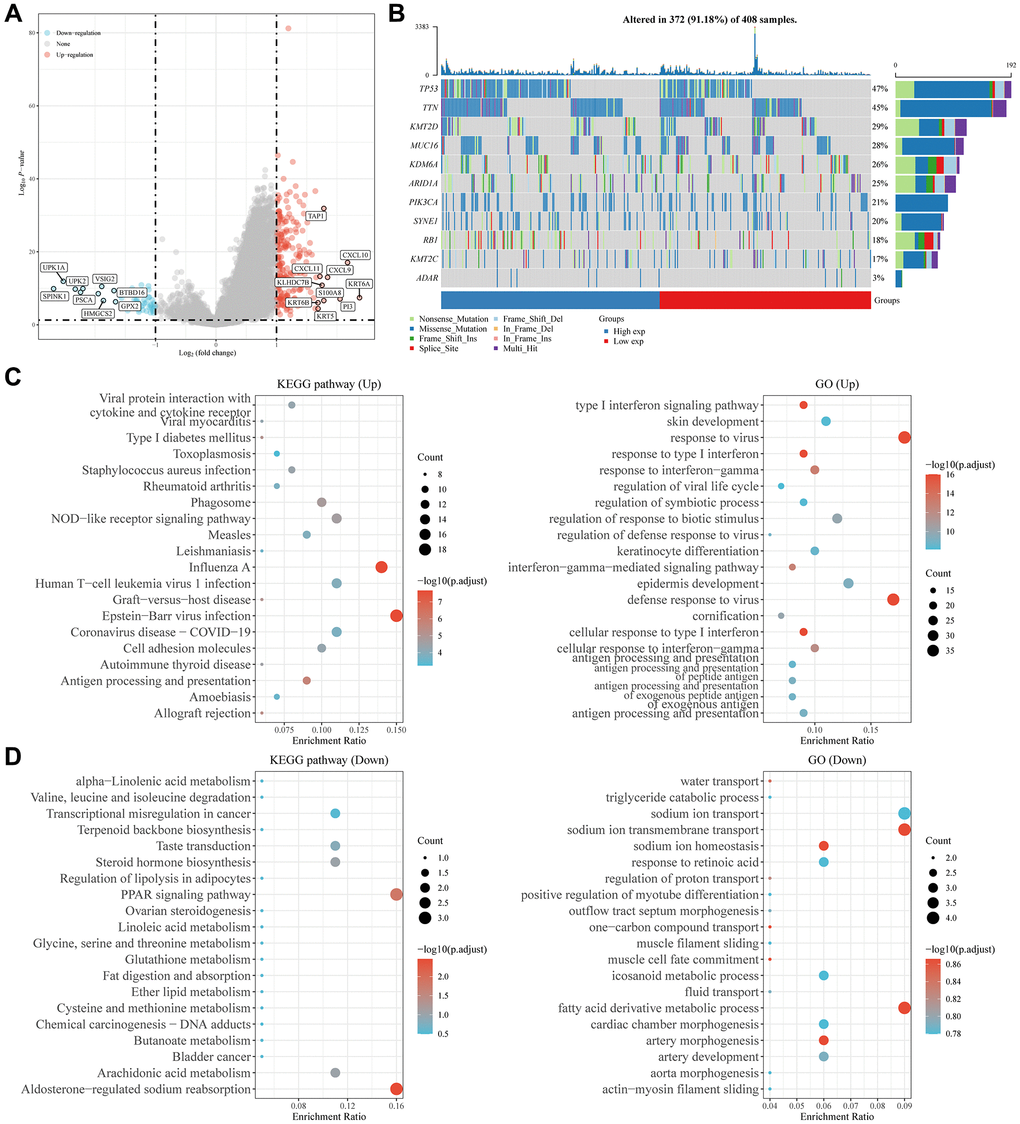
Figure 6.Potential functions and molecular pathways of ADAR in BLCA. (A) Differential analysis between the ADAR high-expression group and the ADAR low-expression group. (B) High ADAR expression predicts a higher frequency of gene mutations. (C, D) GO and KEGG enrichment analysis of differentially expressed genes.