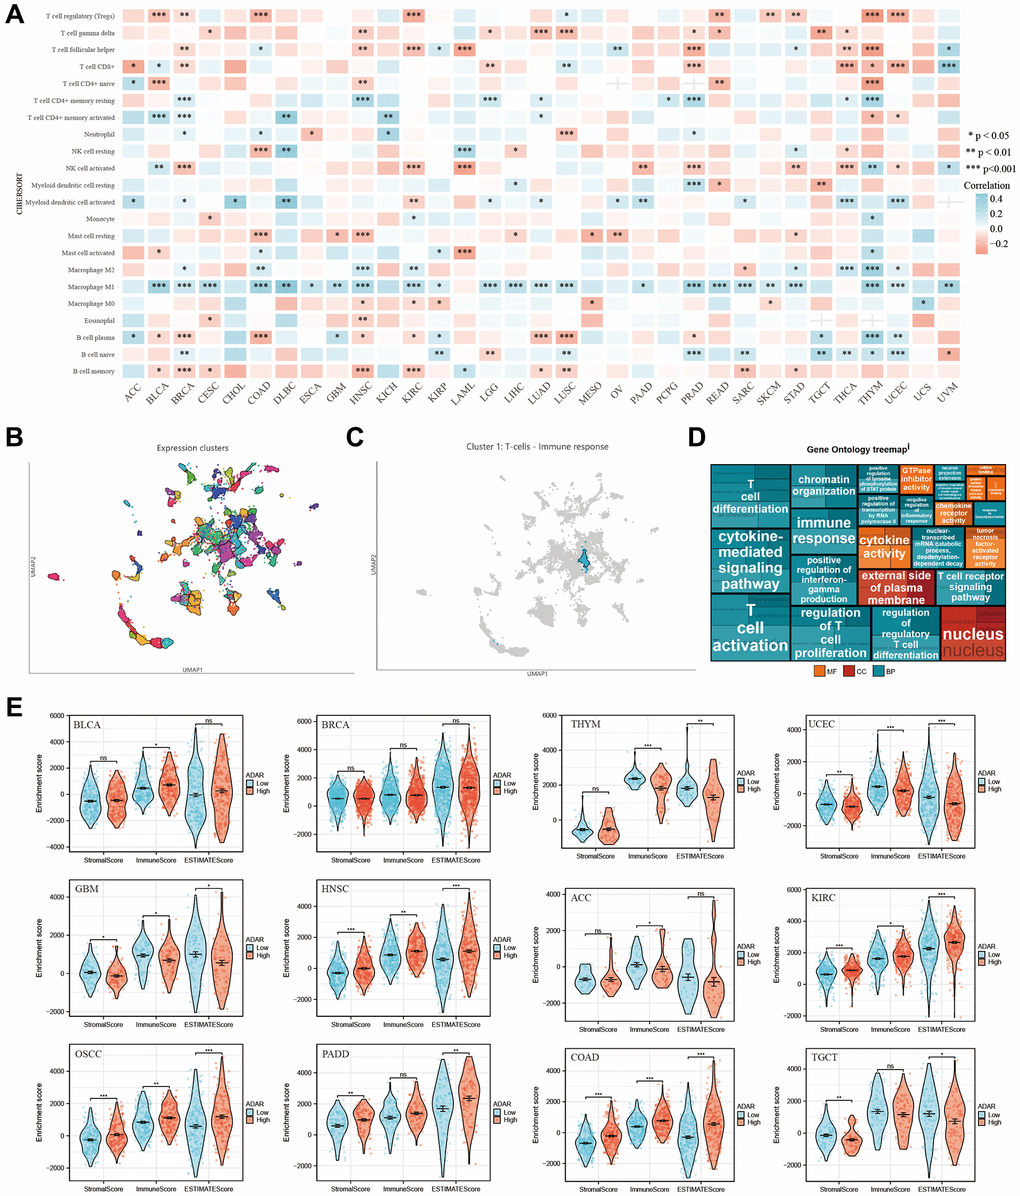
Figure 4.Correlation between ADAR Expression and immune infiltration of cancers. (A) ADAR was correlated with the number of immune cells in most tumors. (B, C) In the HPA single-cell dataset, correlation analysis between ADAR expression and immune cell clustering revealed that ADAR is a part of cluster-1 (T cells—immune response), with high annotation reliability. (D) Gene ontology treemap describes that ADAR is significantly correlated with immune response and T cell activation, differentiation, and proliferation. (E) Negative correlations were observed in ACC, GBM, TGCT, THYM, and UCEC.