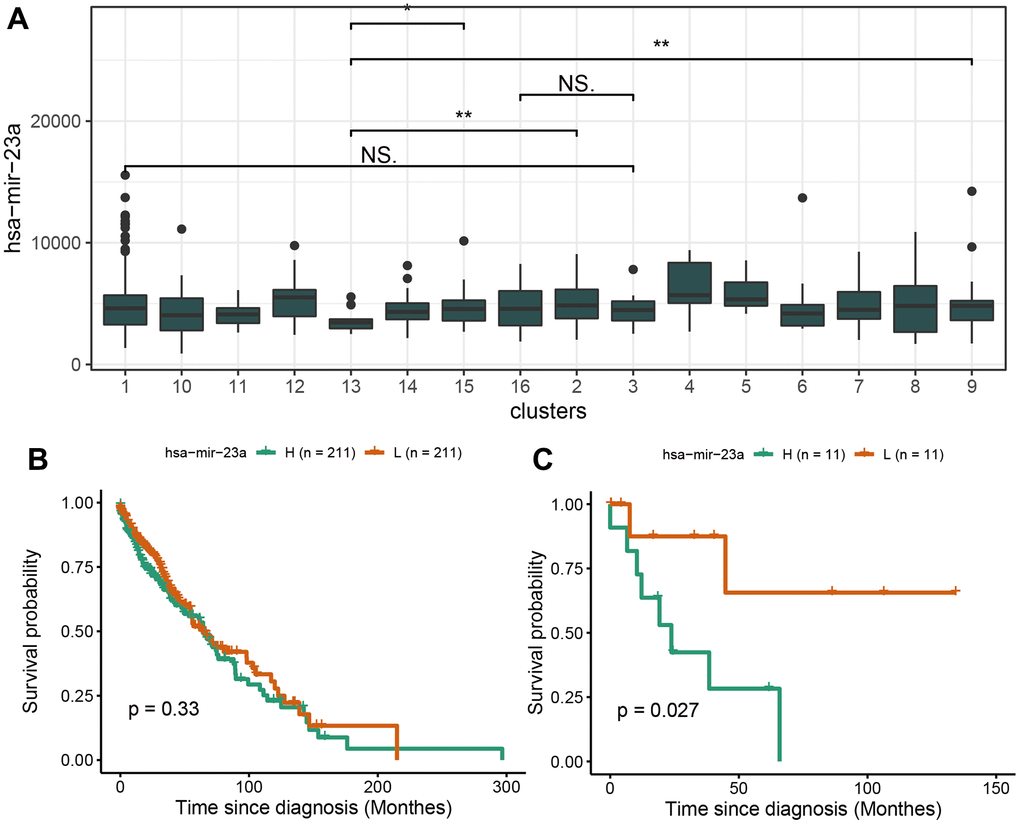
Figure 9.Survival analysis of hsa-miR-23a. (A) The expression profile of hsa-miR-23a in 16 clusters of LUSC. (B) The survival analysis of hsa-miR-23a in overall LUSC samples. (C) The survival analysis of hsa-miR-23a in RASA1-mutation cluster of LUSC.