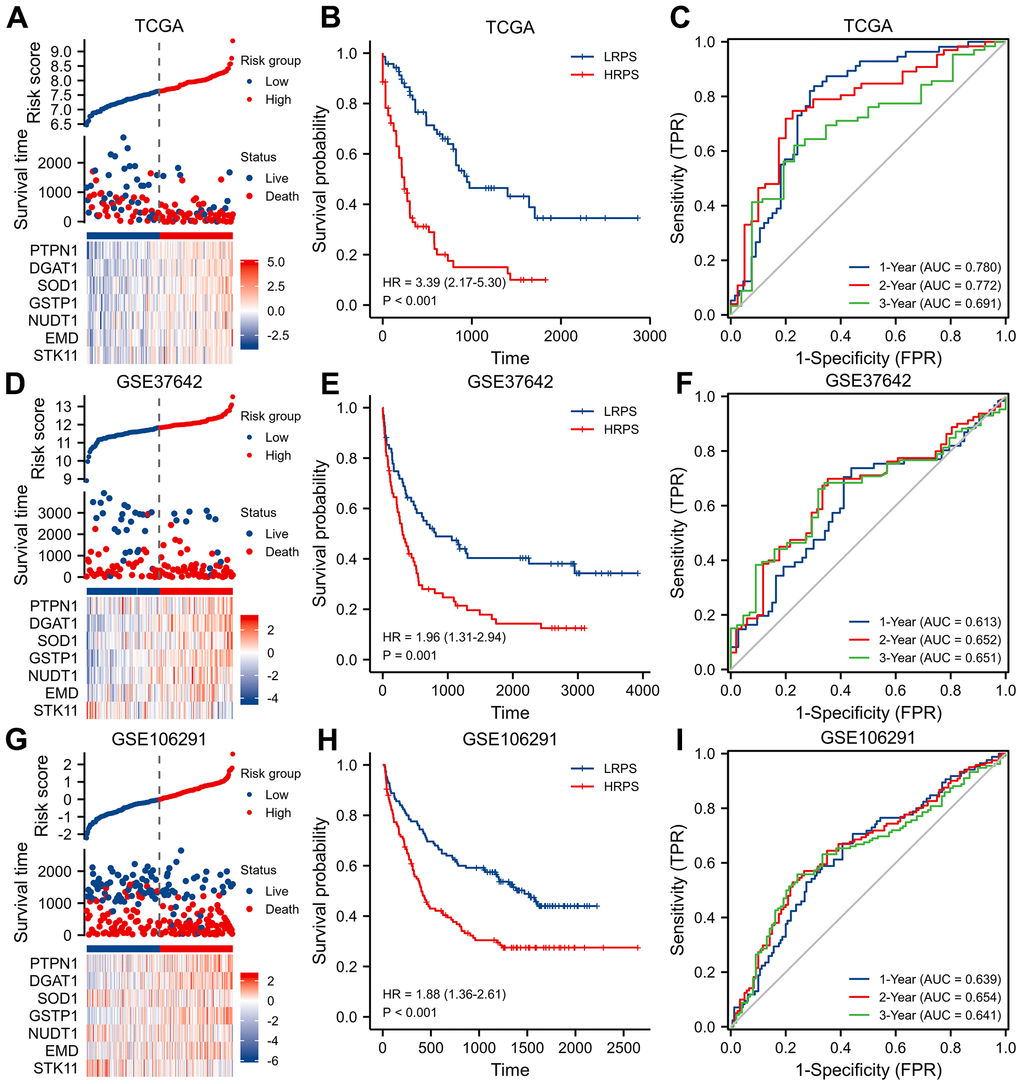
Figure 2.Identification and validation of a seven-ARGs prognostic model. (A) Plot of risk classification, survival status and heatmap of seven-ARGs; (B) curve of OS (Overall Survival) stratified by high-risk prognostic score (HRPS)-group/high-risk group and low-risk prognostic score (LRPS)-group/low-risk group; (C) curves of time-dependent ROC (receiver operator characteristic) in training set. (D–F) Plot of risk classification, survival status and heatmap of seven-ARGs; curve of OS; curves of time-dependent ROC in validation set of GSE37642. (G–I) Plot of risk classification, survival status and heatmap of seven-ARGs; curve of OS; curves of time-dependent ROC in validation set of GSE106291.