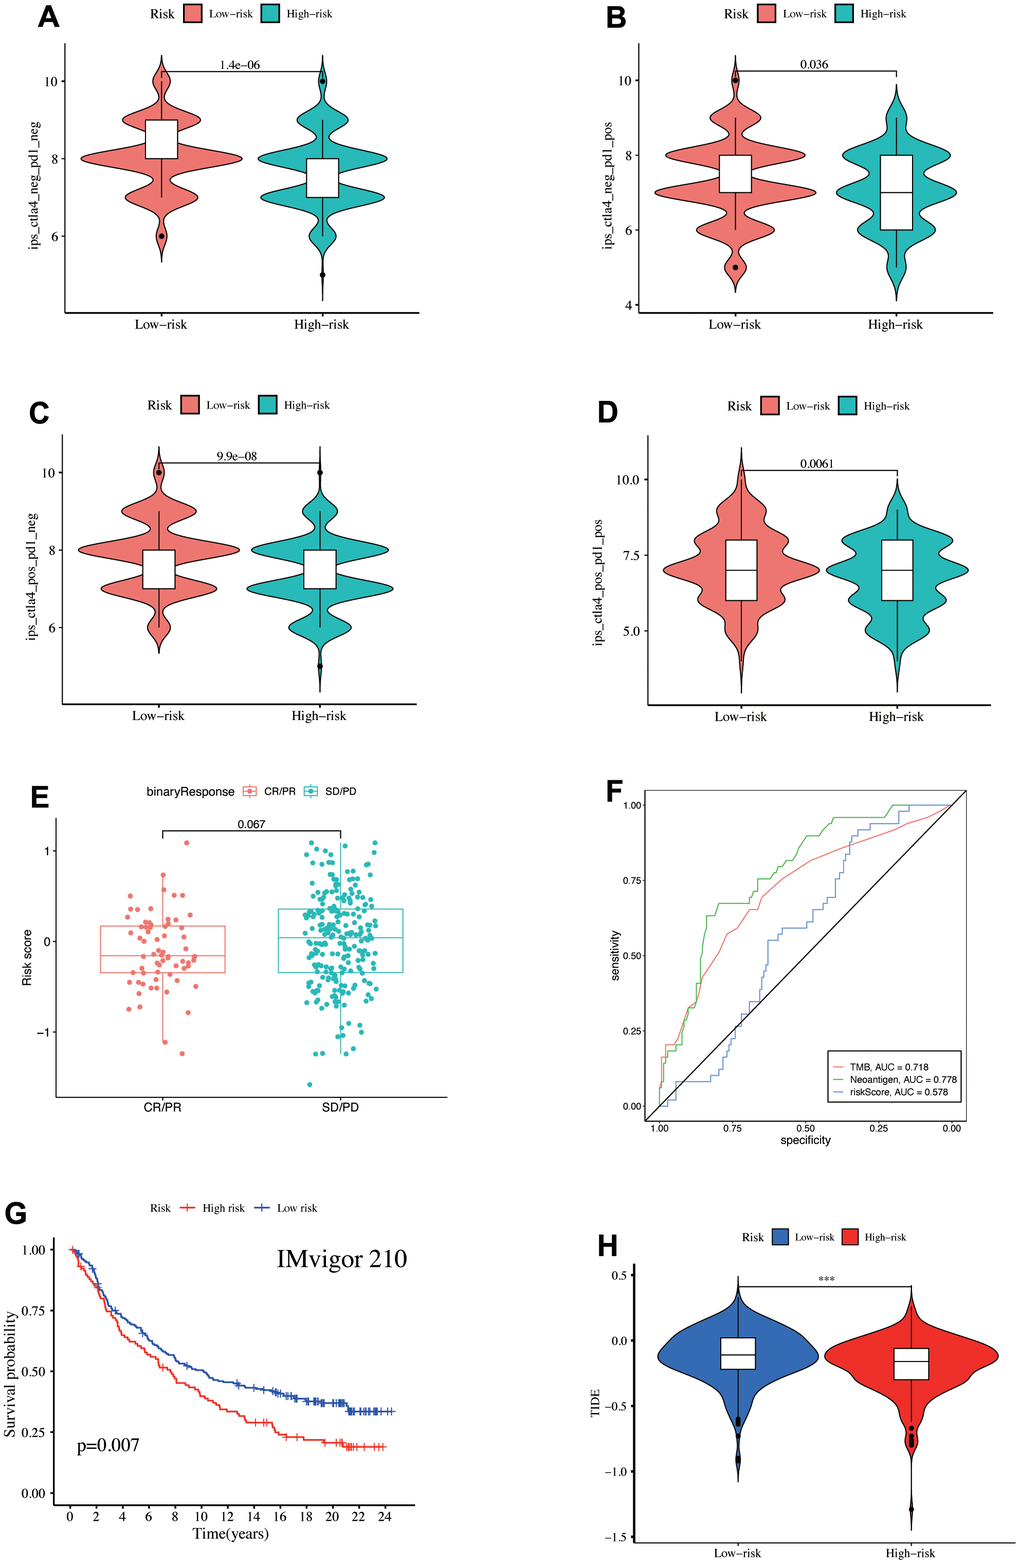
Figure 8.(A–D) IPS score differences. Validation of the model's ability to predict immunotherapy response in the IMvigor210 cohort, (E) Comparison of the risk score differences between CR + PR and SD + PD groups, (F) ROC curve illustrated the ability of TMB, Neoantigen, and risk-score to predict the efficacy of immunotherapy, (G) survival prognosis of high- and low-risk groups. (H) TIDE score differences in the TCGA database.